Exhibit 99.1
Investor Event October 2019 Bob McCormick – President & CEO
2 2 The following presentation contains certain forward - looking statements within the meaning of Section 21 E of the Securities Exchange Act of 1934 , as amended . These statements include information relating to future events, future financial performance, strategies, expectations, competitive environment, regulation, product demand, the payment of dividends, and availability of financial resources . These statements are often identified by use of words such as "anticipate," "believe," "intend," "estimate," "expect," "continue," "should," "could," "may," "plan," "project,“ “goals,” "predict," "will" and similar expressions and include references to assumptions and relate to our future prospects, developments and business strategies . Such statements involve known and unknown risks, uncertainties and other factors that could cause our actual results, performance or achievements to be materially different from any future results, performance or achievements expressed or implied by these forward - looking statements . Factors that could cause or contribute to such differences include, but are not limited to, weather conditions, particularly lack of or reduced levels of snowfall and the timing of such snowfall, our inability to maintain good relationships with our distributors, our inability to maintain good relationships with the original equipment manufacturers with whom we currently do significant business, lack of available or favorable financing options for our end - users, distributors or customers, the potential that we may be required to recognize goodwill impairment attributable to our Work Truck Solutions segment, increases in the price of steel or other materials, including as a result of tariffs, necessary for the production of our products that cannot be passed on to our distributors, increases in the price of fuel or freight, a significant decline in economic conditions, the inability of our suppliers and original equipment manufacturer partners to meet our volume or quality requirements, inaccuracies in our estimates of future demand for our products, our inability to protect or continue to build our intellectual property portfolio, the effects of laws and regulations and their interpretations on our business and financial condition, our inability to develop new products or improve upon existing products in response to end - user needs, losses due to lawsuits arising out of personal injuries associated with our products, factors that could impact the future declaration and payment of dividends, our inability to compete effectively against competition, our inability to achieve the projected financial performance with the assets of Dejana Truck & Utility Equipment Company, Inc . , which we acquired in 2016 , and unexpected costs or liabilities related to such acquisitions, as well as those discussed in the section entitled “Risk Factors” in our annual report on Form 10 - K for the year ended December 31 , 2018 . You should not place undue reliance on these forward - looking statements . In addition, the forward - looking statements in this release speak only as of the date hereof and we undertake no obligation, except as required by law, to update or release any revisions to any forward - looking statement, even if new information becomes available in the future . Forward Looking Statements
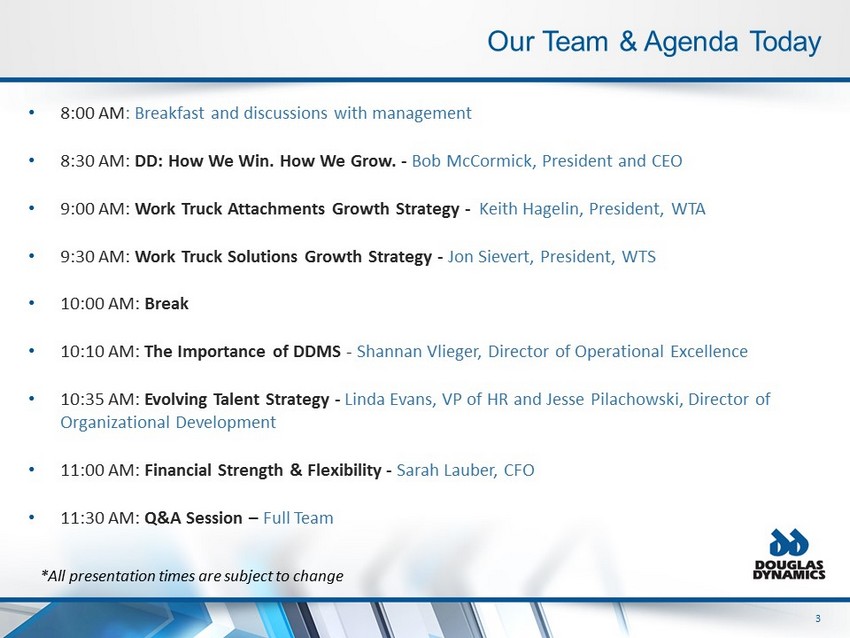
3 3 Our Team & Agenda Today • 8:00 AM : Breakfast and discussions with management • 8:30 AM: DD: How We Win. How We Grow. - Bob McCormick, President and CEO • 9:00 AM: Work Truck Attachments Growth Strategy - Keith Hagelin, President, WTA • 9:30 AM: Work Truck Solutions Growth Strategy - Jon Sievert, President, WTS • 10:00 AM: Break • 10:10 AM: The Importance of DDMS - Shannan Vlieger, Director of Operational Excellence • 10:35 AM: Evolving Talent Strategy - Linda Evans, VP of HR and Jesse Pilachowski, Director of Organizational Development • 11:00 AM: Financial Strength & Flexibility - Sarah Lauber, CFO • 11:30 AM: Q&A Session – Full Team *All presentation times are subject to change
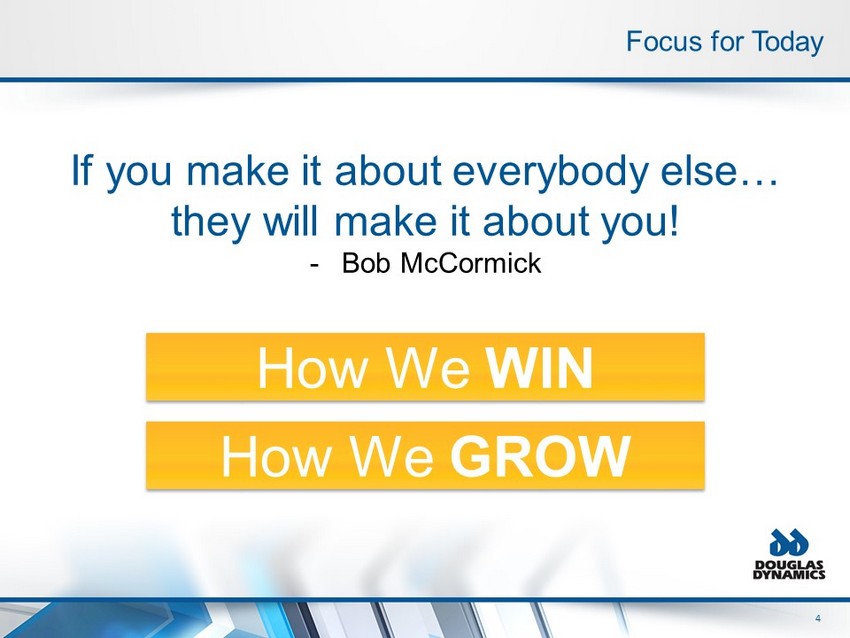
4 4 Focus for Today If you make it about everybody else… they will make it about you! - Bob McCormick How We WIN How We GROW
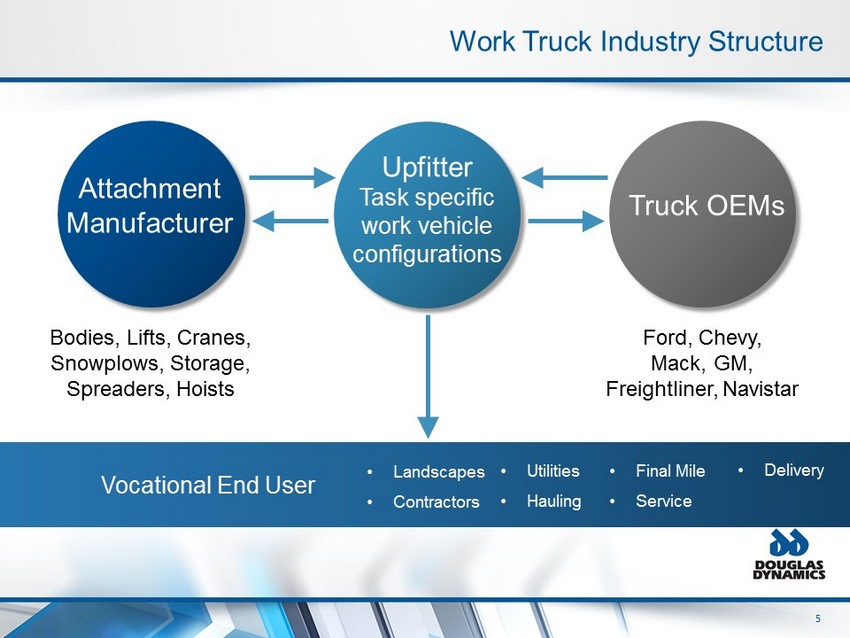
5 5 Work Truck Industry Structure Ford, Chevy, Mack, GM, Freightliner, Navistar Bodies, Lifts, Cranes, Snowplows, Storage, Spreaders, Hoists Attachment Manufacturer Upfitter Task specific work vehicle configurations Truck OEMs Vocational End User • Landscapes • Contractors • Utilities • Hauling • Final Mile • Service • Delivery
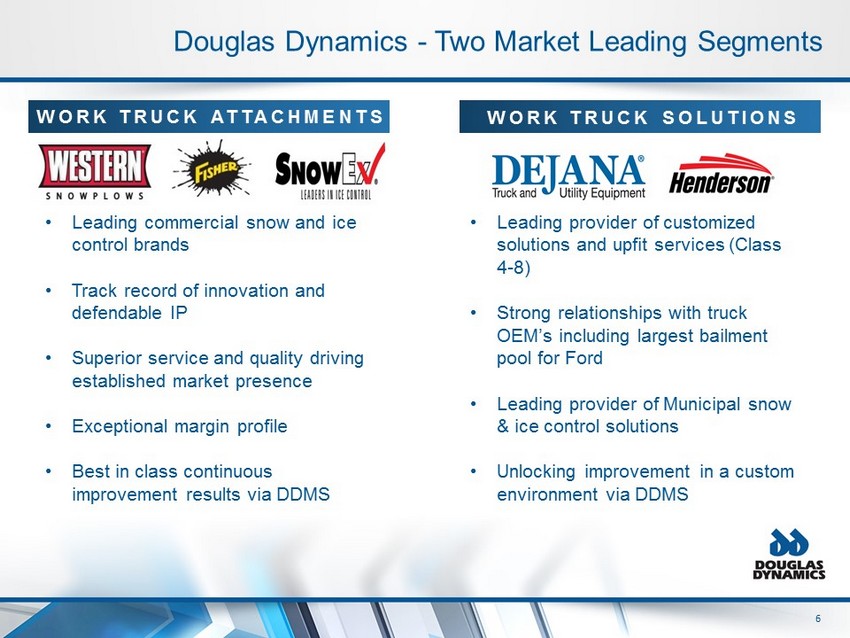
6 6 WORK TRUCK ATTACHMENTS Douglas Dynamics - Two Market Leading Segments • Leading commercial snow and ice control brands • Track record of innovation and defendable IP • Superior service and quality driving established market presence • Exceptional margin profile • Best in class continuous improvement results via DDMS • Leading provider of customized solutions and upfit services (Class 4 - 8) • Strong relationships with truck OEM’s including largest bailment pool for Ford • Leading provider of Municipal snow & ice control solutions • Unlocking improvement in a custom environment via DDMS WORK TRUCK SOLUTIONS
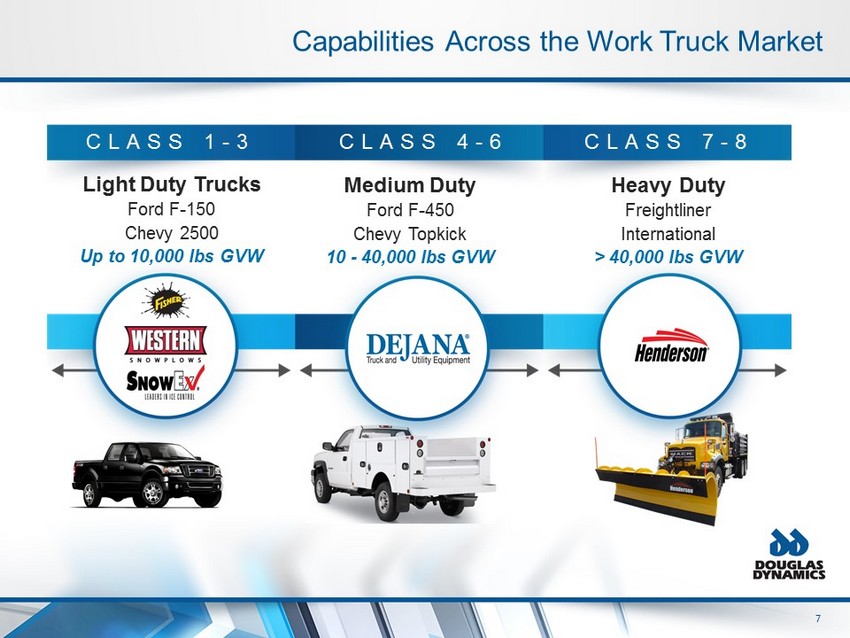
7 7 Capabilities Across the Work Truck Market CLASS 1 - 3 CLASS 4 - 6 CLASS 7 - 8 Light Duty Trucks Ford F - 150 Chevy 2500 Up to 10,000 lbs GVW Heavy Duty Freightliner International > 40,000 lbs GVW Medium Duty Ford F - 450 Chevy Topkick 10 - 40,000 lbs GVW WTA DTE WTA
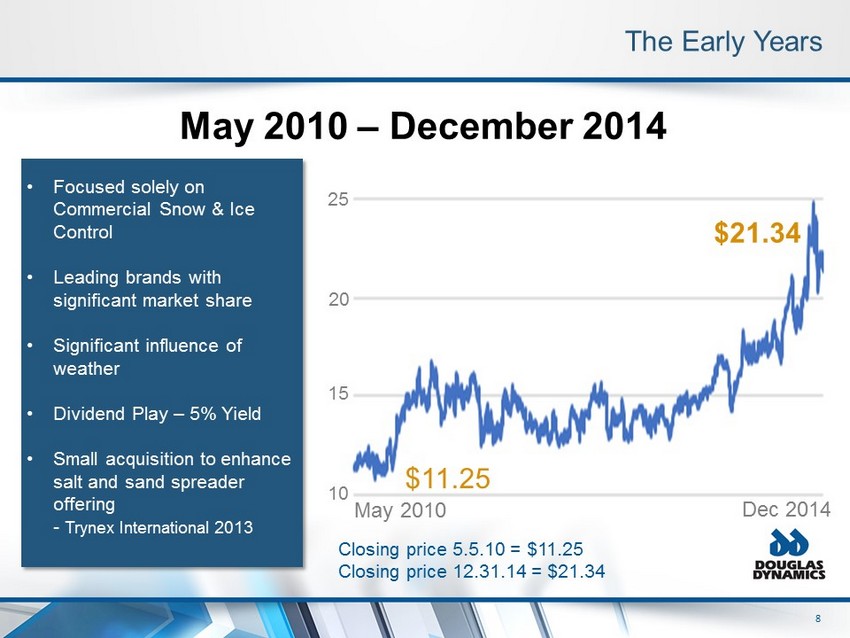
8 8 The Early Years May 2010 – December 2014 May 2010 Dec 2014 25 20 15 10 • Focused solely on Commercial Snow & Ice Control • Leading brands with significant market share • Significant influence of weather • Dividend Play – 5% Yield • Small acquisition to enhance salt and sand spreader offering - Trynex International 2013 $11.25 $21.34 Closing price 5.5.10 = $11.25 Closing price 12.31.14 = $21.34
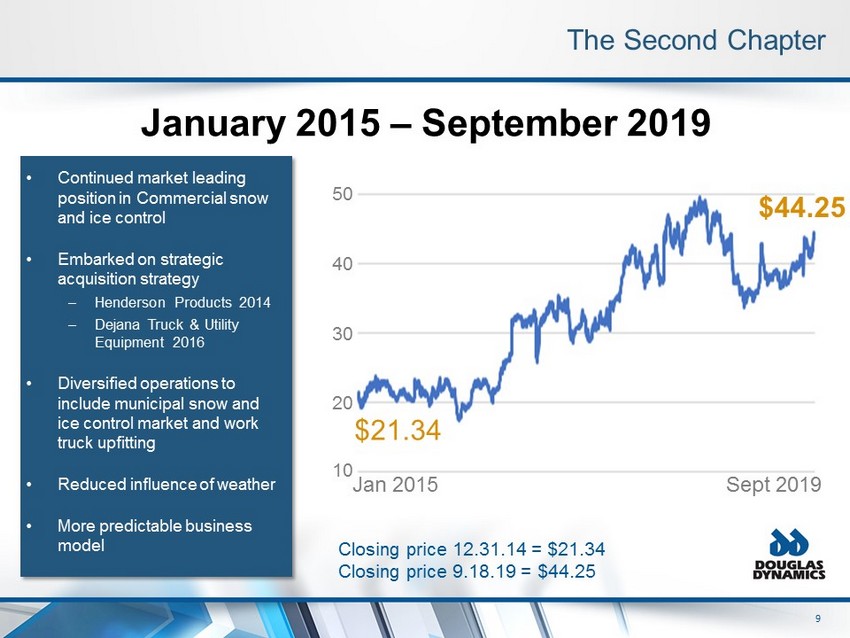
9 9 The Second Chapter • Continued market leading position in Commercial snow and ice control • Embarked on strategic acquisition strategy – Henderson Products 2014 – Dejana Truck & Utility Equipment 2016 • Diversified operations to include municipal snow and ice control market and work truck upfitting • Reduced influence of weather • More predictable business model January 2015 – September 2019 Jan 2015 Sept 2019 $21.34 $44.25 50 40 30 20 10 Closing price 12.31.14 = $21.34 Closing price 9.18.19 = $44.25
10 10 Focused on Creating Value THE 3 P’s Products People Customers & Employees Profits
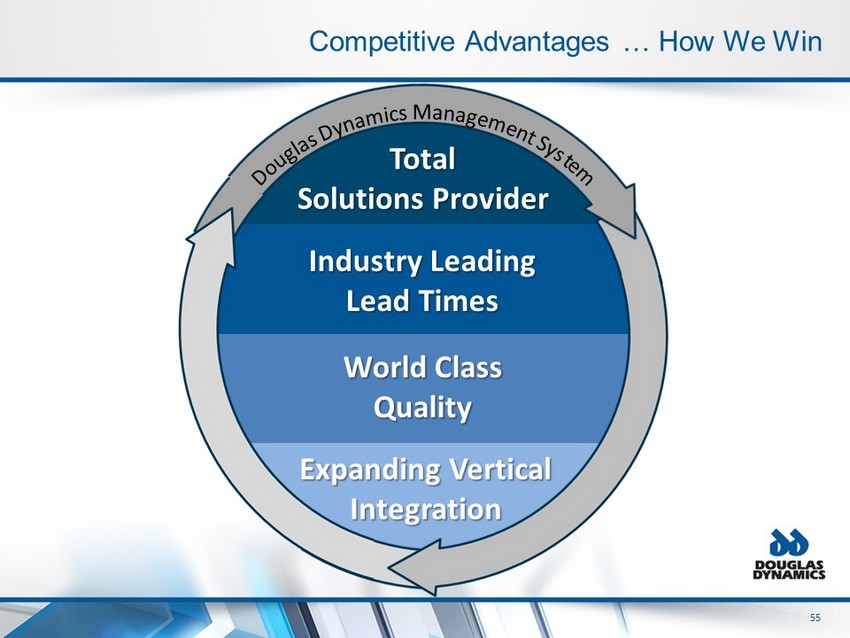
11 11 Total Solutions Provider Industry Leading Lead Times World Class Quality Competitive Advantages … How We Win
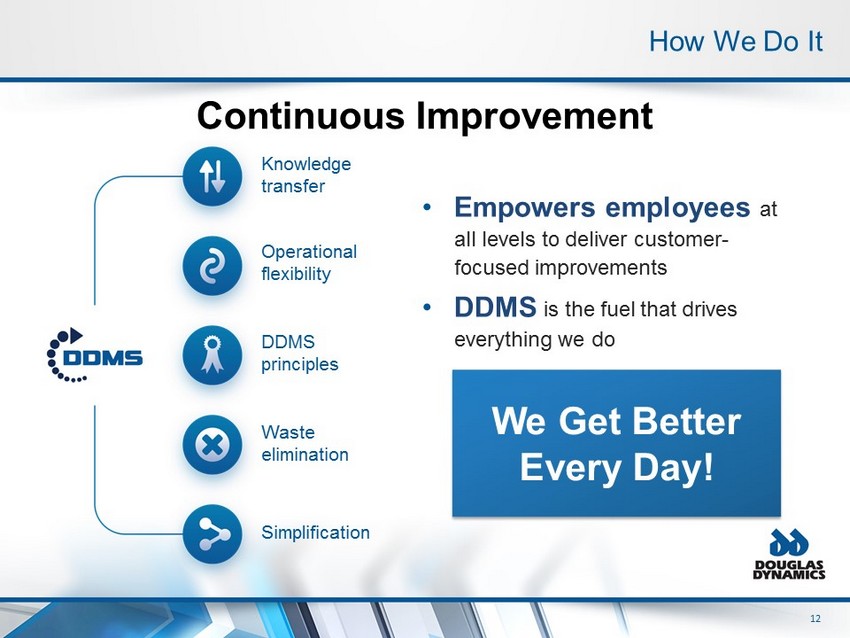
12 12 How We Do It • Empowers employees at all levels to deliver customer - focused improvements • DDMS is the fuel that drives everything we do Knowledge transfer Operational flexibility DDMS principles Waste elimination Simplification Continuous Improvement We Get Better Every Day!
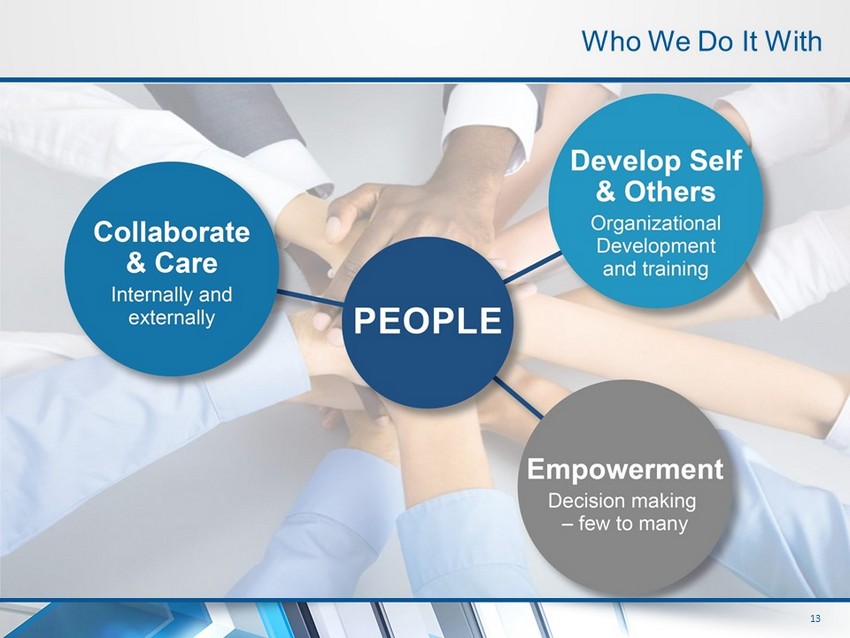
13 13 Who We Do It With
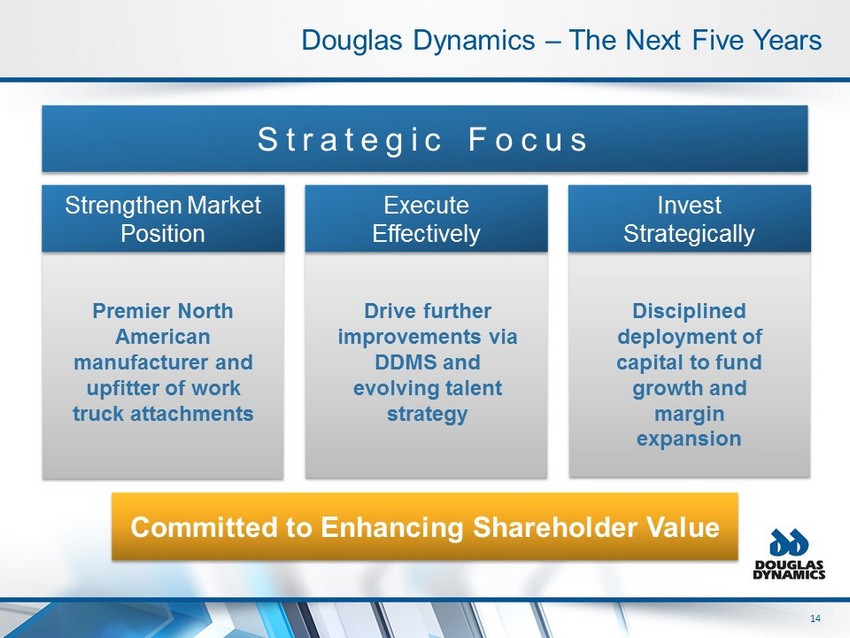
14 14 Douglas Dynamics – The Next Five Years Strengthen Market Position Execute Effectively Invest Strategically Premier North American manufacturer and upfitter of work truck attachments Drive further improvements via DDMS and evolving talent strategy Disciplined deployment of capital to fund growth and margin expansion Strategic Focus Committed to Enhancing Shareholder Value

WTA Growth Strategy October 2019 Keith Hagelin – President, Work Truck Attachments
16 16 Work Truck Attachments Growth Strategy
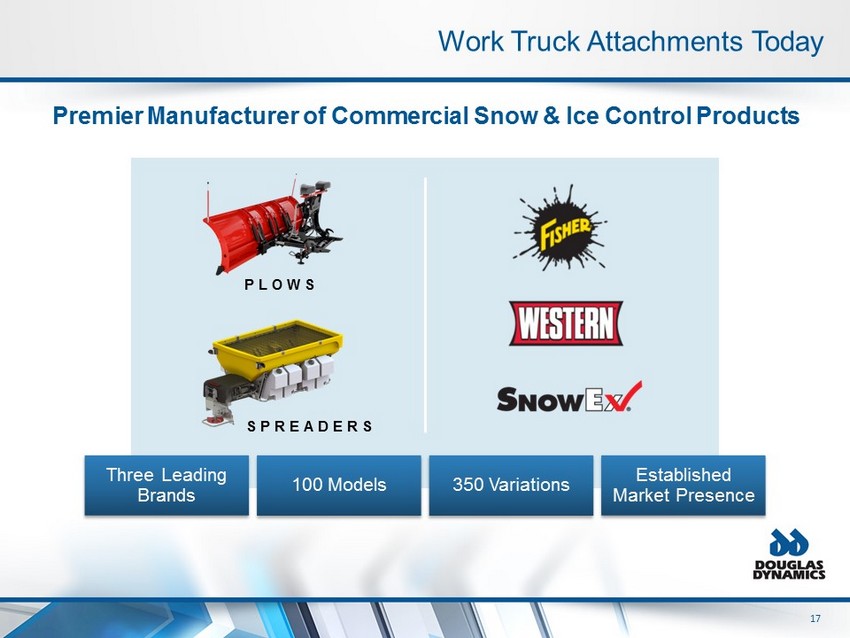
17 17 Work Truck Attachments Today PLOWS SPREADERS Premier Manufacturer of Commercial Snow & Ice Control Products Three Leading Brands 100 Models 350 Variations Established Market Presence
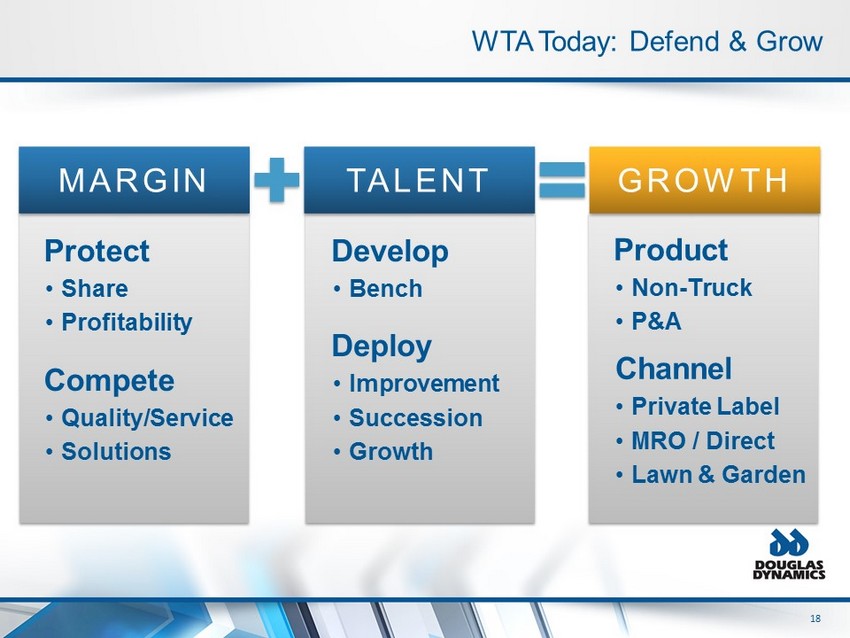
18 18 Product • Non - Truck • P&A Channel • Private Label • MRO / Direct • Lawn & Garden WTA Today: Defend & Grow Protect • Share • Profitability Compete • Quality/Service • Solutions Develop • Bench Deploy • Improvement • Succession • Growth MARGIN TALENT GROWTH
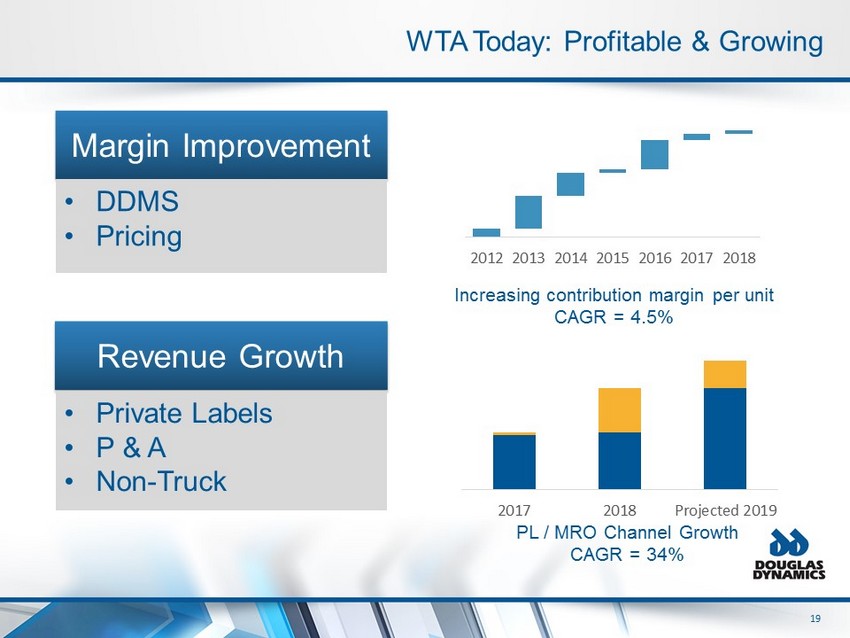
19 19 Increasing contribution margin per unit CAGR = 4.5% WTA Today: Profitable & Growing PL / MRO Channel Growth CAGR = 34% Margin Improvement Revenue Growth • DDMS • Pricing • Private Labels • P & A • Non - Truck 2012 2013 2014 2015 2016 2017 2018 2017 2018 Projected 2019
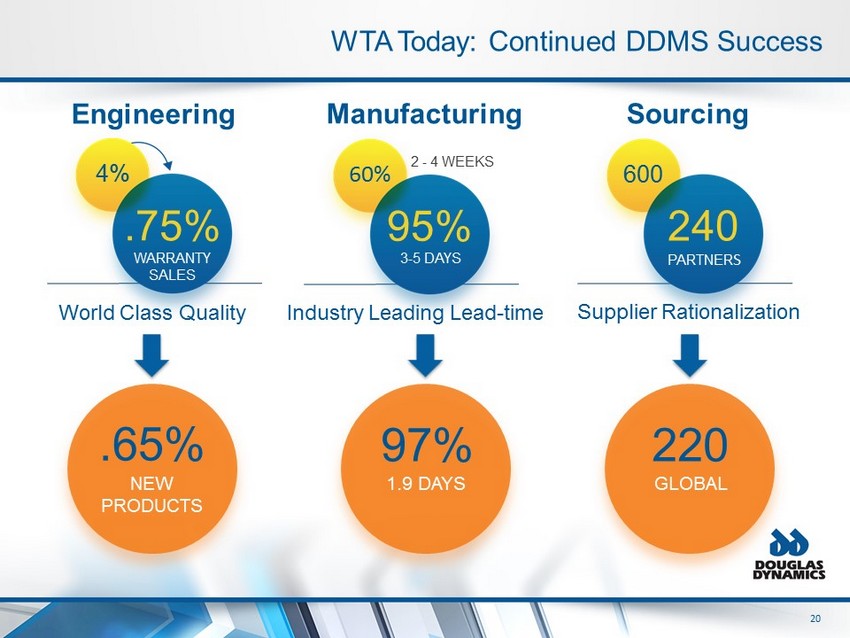
20 20 WTA Today: Continued DDMS Success Industry Leading Lead - time 60% 95% 2 - 4 WEEKS 3 - 5 DAYS Supplier Rationalization 600 240 PARTNER S World Class Quality 4% .75% WARRANTY SALES Engineering Manufacturing Sourcing .65% 97% 220 NEW PRODUCTS 1.9 DAYS GLOBAL
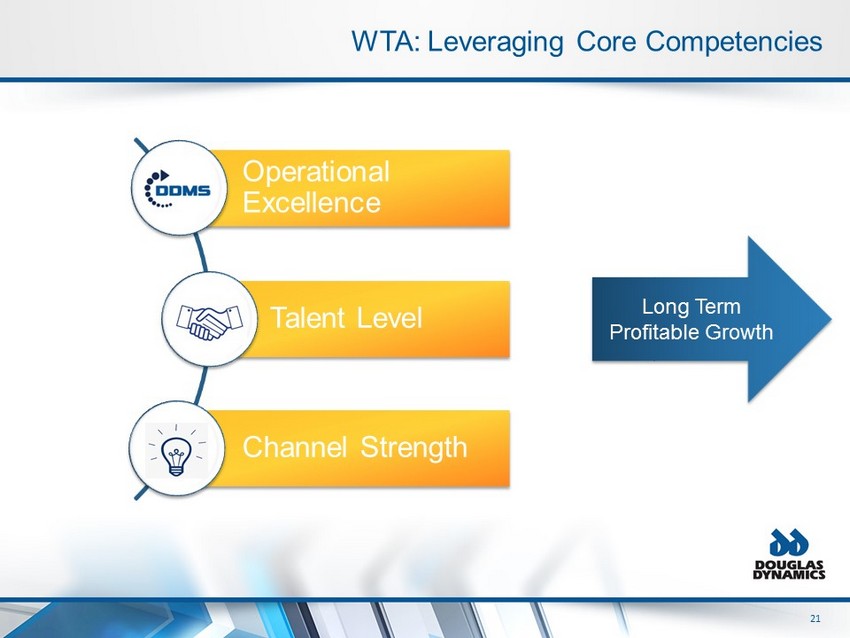
21 21 WTA: Leveraging Core Competencies Operational Excellence Talent Level Channel Strength Long Term Profitable Growth
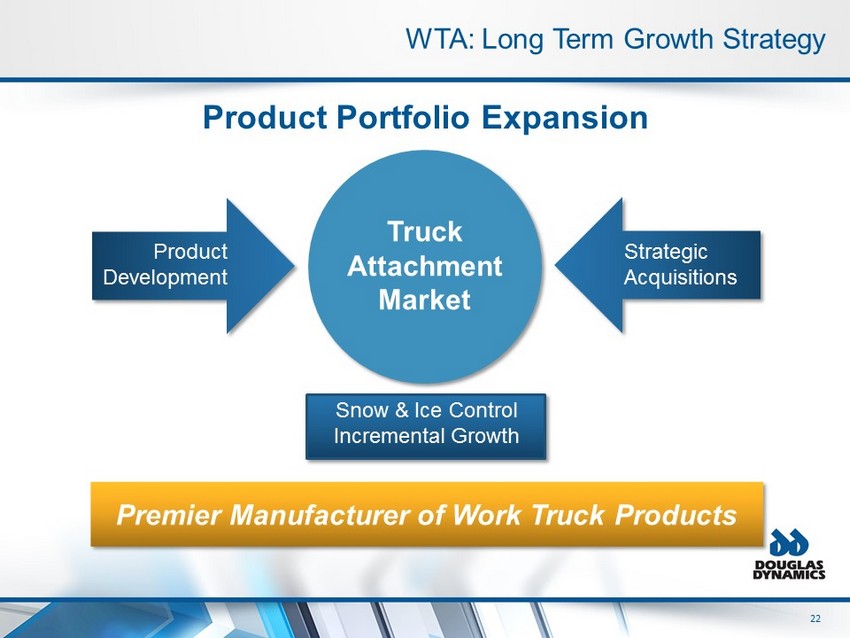
22 22 WTA: Long Term Growth Strategy Product Portfolio Expansion Product Development Strategic Acquisitions Truck Attachment Market Premier Manufacturer of Work Truck Products Snow & Ice Control Incremental Growth
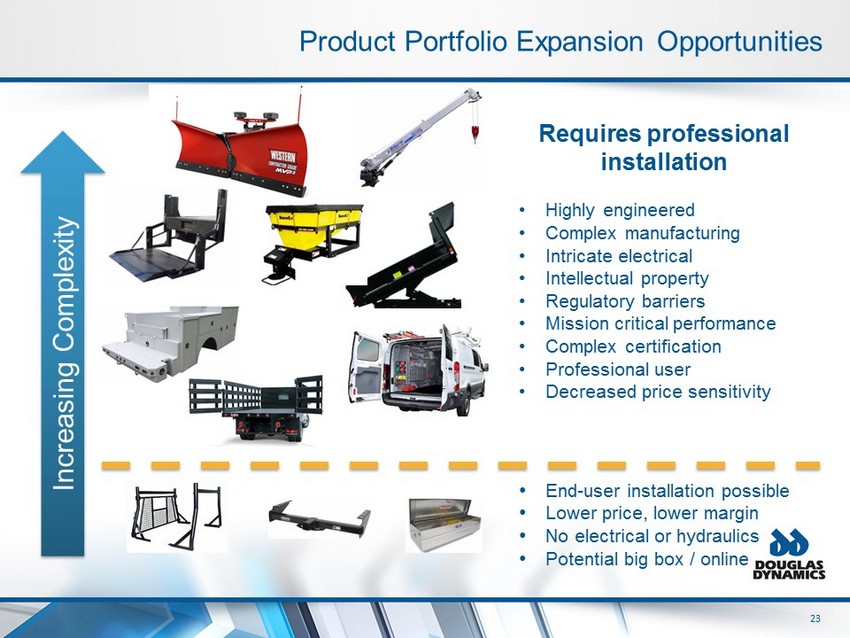
23 23 Product Portfolio Expansion Opportunities Requires professional installation • Highly engineered • Complex manufacturing • Intricate electrical • Intellectual property • Regulatory barriers • Mission critical performance • Complex certification • Professional user • Decreased price sensitivity • End - user installation possible • Lower price, lower margin • No electrical or hydraulics • Potential big box / online Increasing Complexity
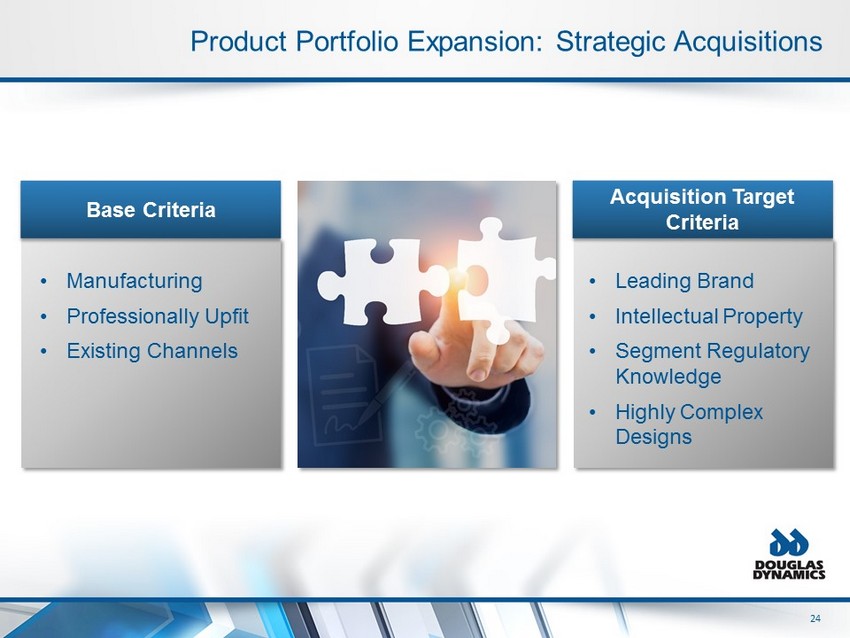
24 24 Product Portfolio Expansion: Strategic Acquisitions Base Criteria Acquisition Target Criteria • Manufacturing • Professionally Upfit • Existing Channels • Leading Brand • Intellectual Property • Segment Regulatory Knowledge • Highly Complex Designs
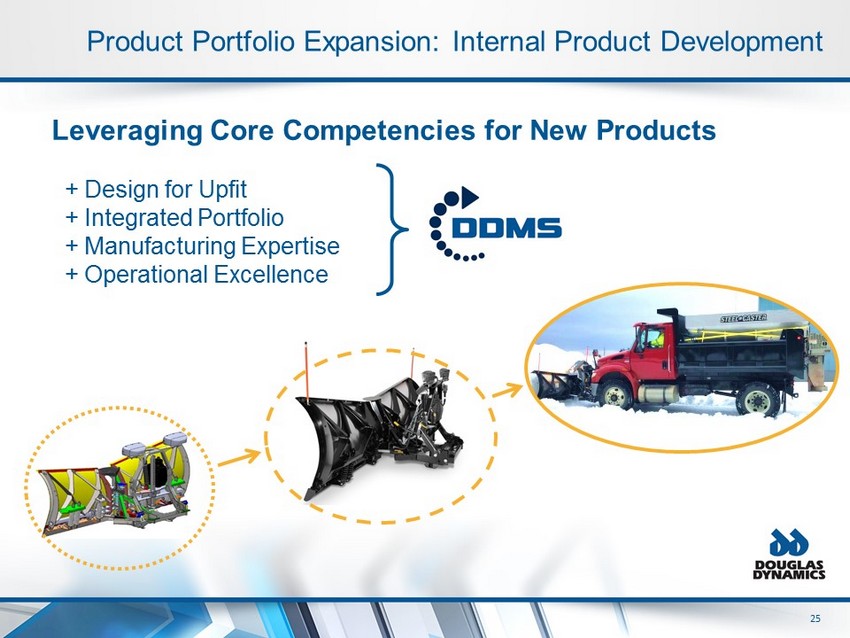
25 25 Product Portfolio Expansion: Internal Product Development Leveraging Core Competencies for New Products + Design for Upfit + Integrated Portfolio + Manufacturing Expertise + Operational Excellence

26 26 Total Solutions Provider Industry Leading Lead Times World Class Quality Product Portfolio Expansion Competitive Advantages … How We Win
Work Truck Solutions October 2019 Jon Sievert – President, Work Truck Solutions
28 28 Growth Strategy
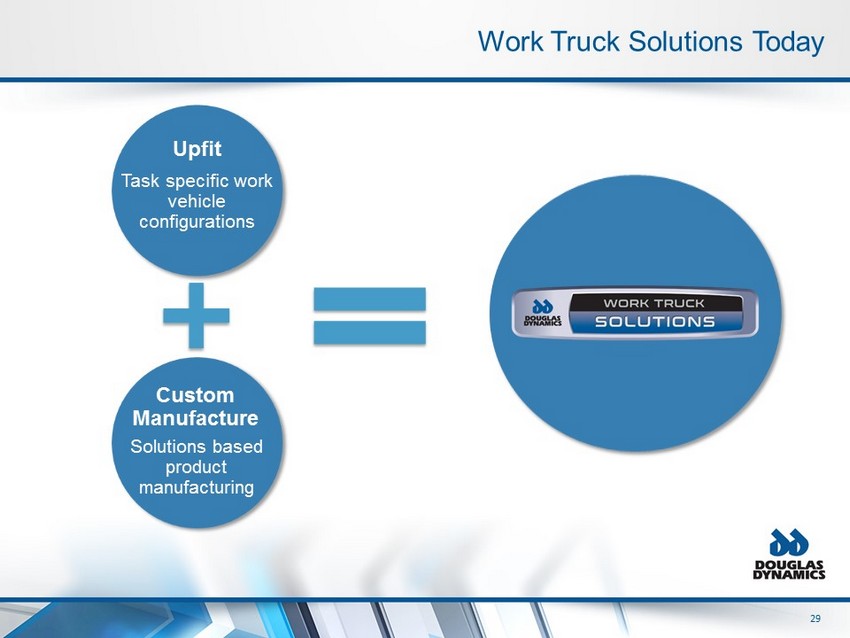
29 29 Upfit Task specific work vehicle configurations Work Truck Solutions Today Custom Manufacture Solutions based product manufacturing
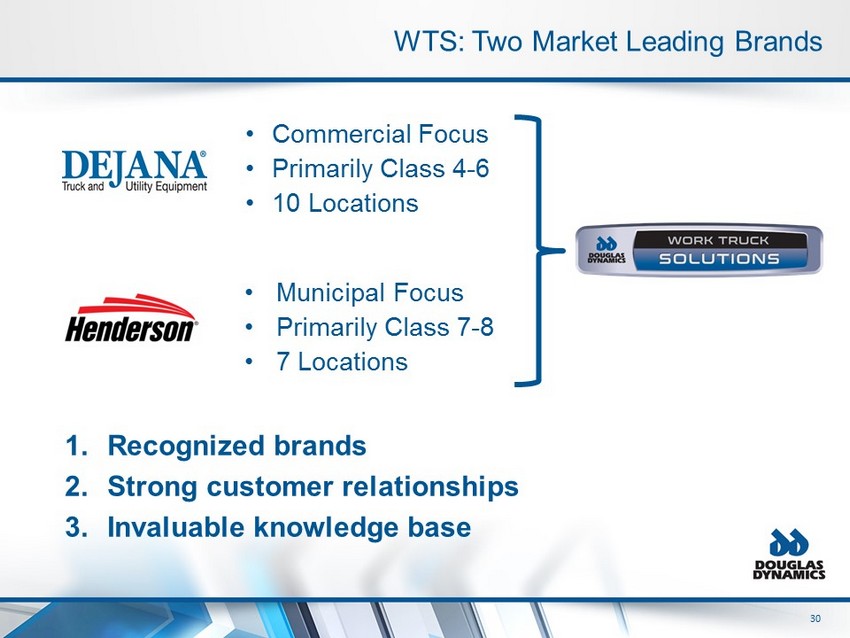
30 30 WTS: Two Market Leading Brands • Commercial Focus • Primarily Class 4 - 6 • 10 Locations • Municipal Focus • Primarily Class 7 - 8 • 7 Locations 1. Recognized brands 2. Strong customer relationships 3. Invaluable knowledge base
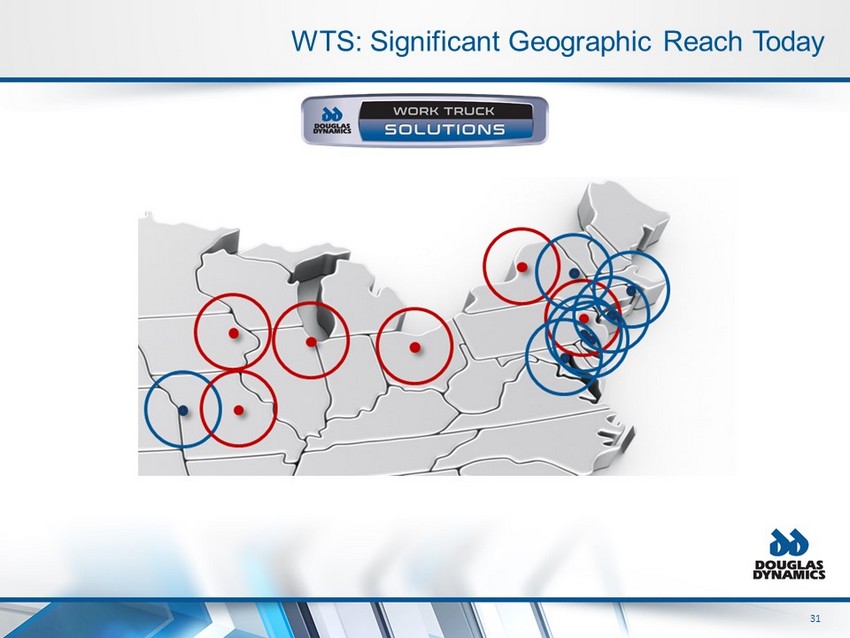
31 31 WTS: Significant Geographic Reach Today
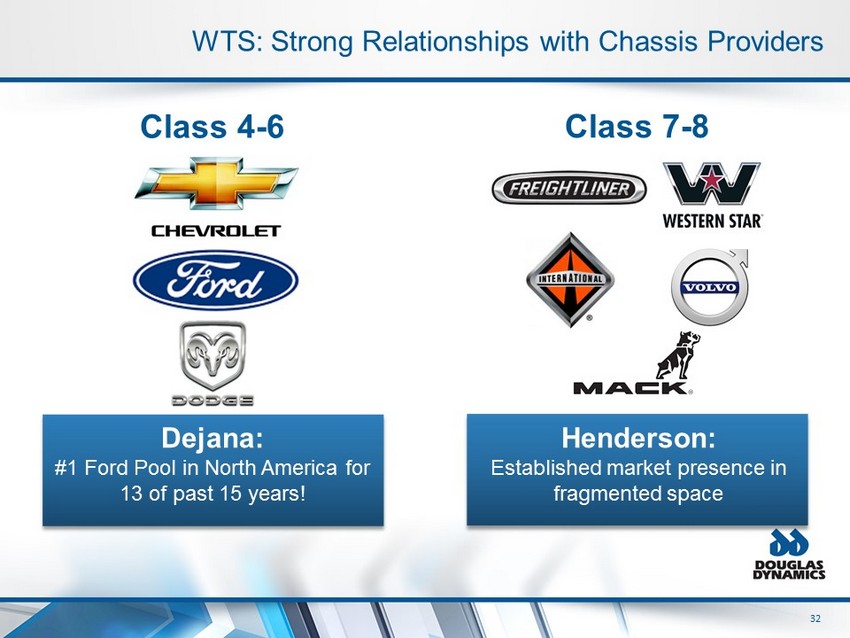
32 32 Dejana: #1 Ford Pool in North America for 13 of past 15 years! WTS: Strong Relationships with Chassis Providers Class 7 - 8 Class 4 - 6 Henderson: Established market presence in fragmented space
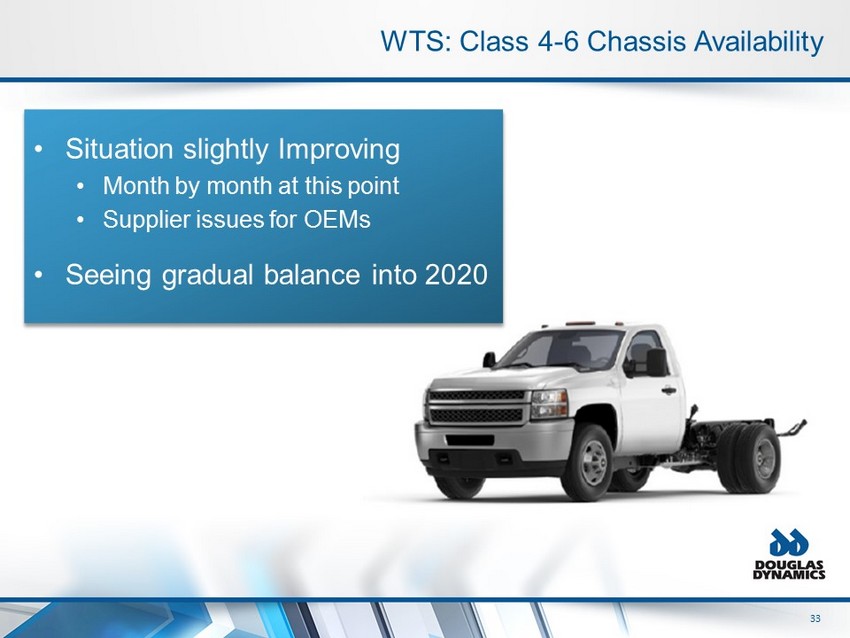
33 33 • Situation slightly Improving • Month by month at this point • Supplier issues for OEMs • Seeing gradual balance into 2020 WTS: Class 4 - 6 Chassis Availability
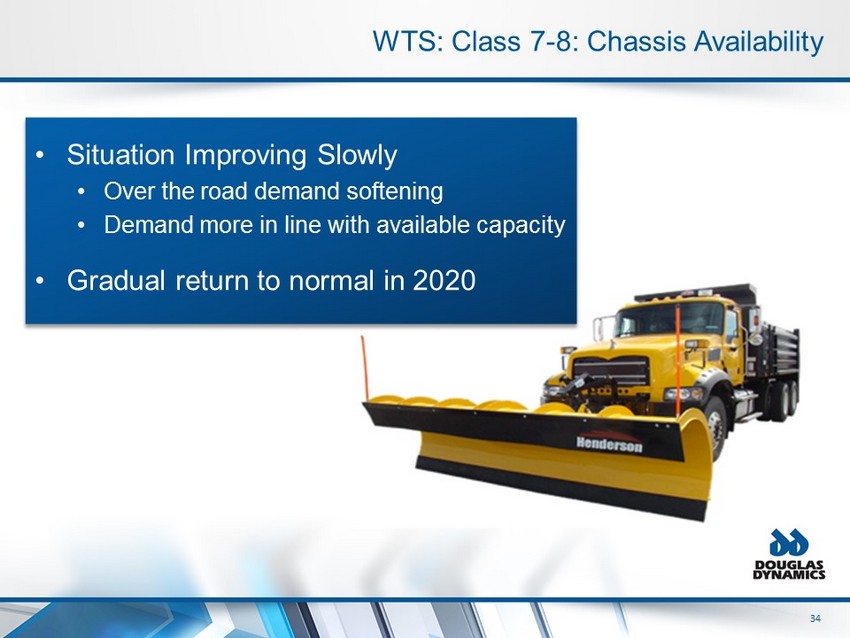
34 34 • Situation Improving Slowly • Over the road demand softening • Demand more in line with available capacity • Gradual return to normal in 2020 WTS: Class 7 - 8: Chassis Availability
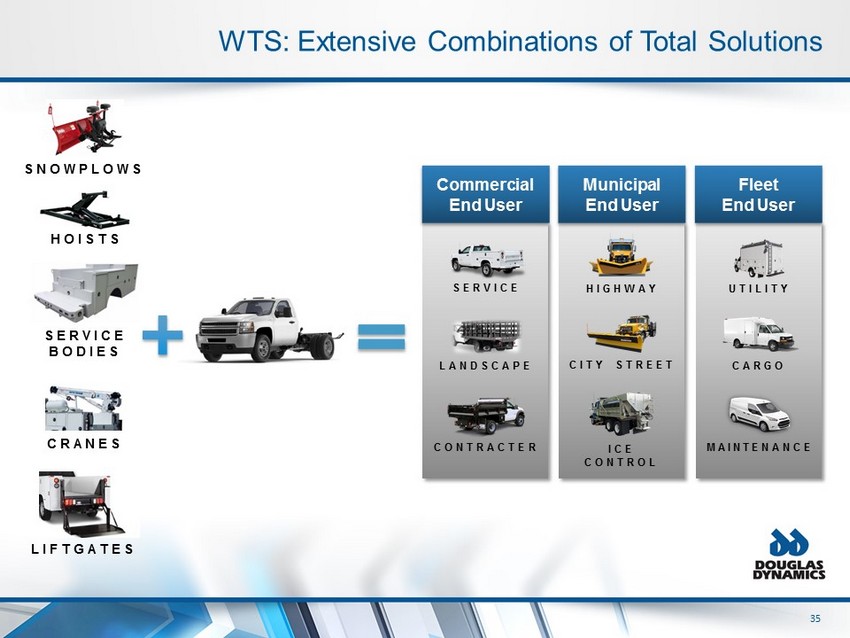
35 35 WTS: Extensive Combinations of Total Solutions Commercial End User SERVICE LANDSCAPE CONTRACTER SNOWPLOWS CRANES SERVICE BODIES LIFTGATES HOISTS HIGHWAY ICE CONTROL CITY STREET Municipal End User UTILITY CARGO MAINTENANCE Fleet End User
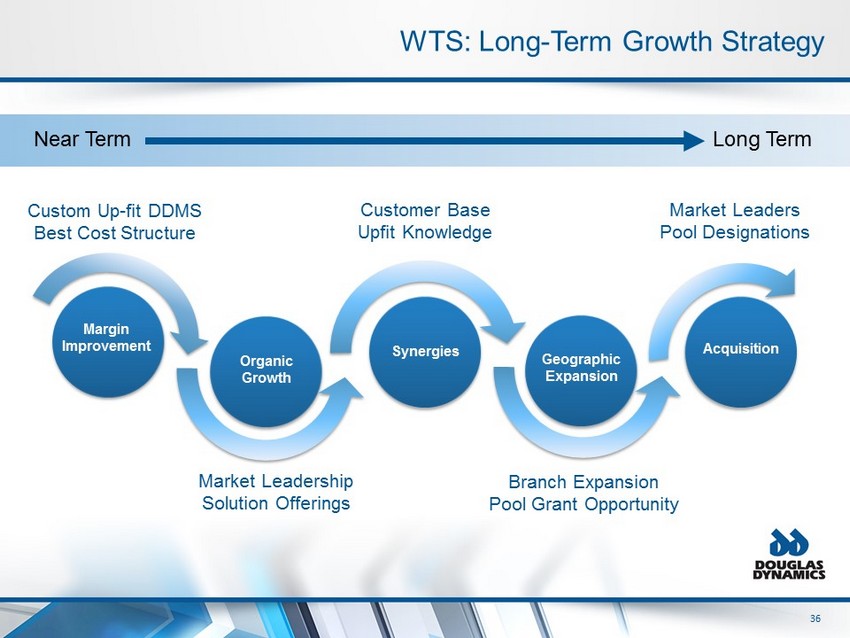
36 36 WTS: Long - Term Growth Strategy Margin Improvement Organic Growth Synergies Geographic Expansion Acquisition Custom Up - fit DDMS Best Cost Structure Market Leadership Solution Offerings Customer Base Upfit Knowledge Branch Expansion Pool Grant Opportunity Market Leaders Pool Designations Near Term Long Term
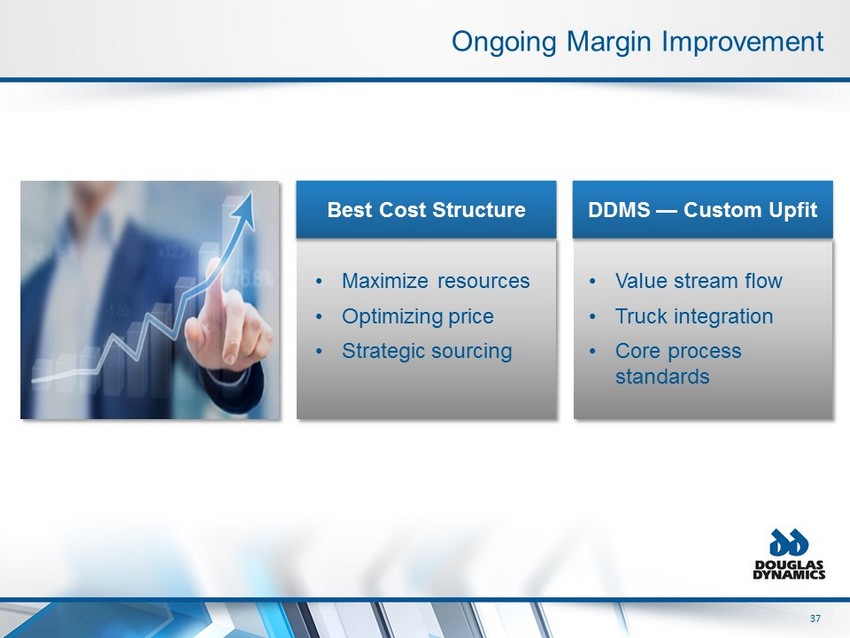
37 37 Ongoing Margin Improvement Best Cost Structure DDMS — Custom Upfit • Maximize resources • Optimizing price • Strategic sourcing • Value stream flow • Truck integration • Core process standards
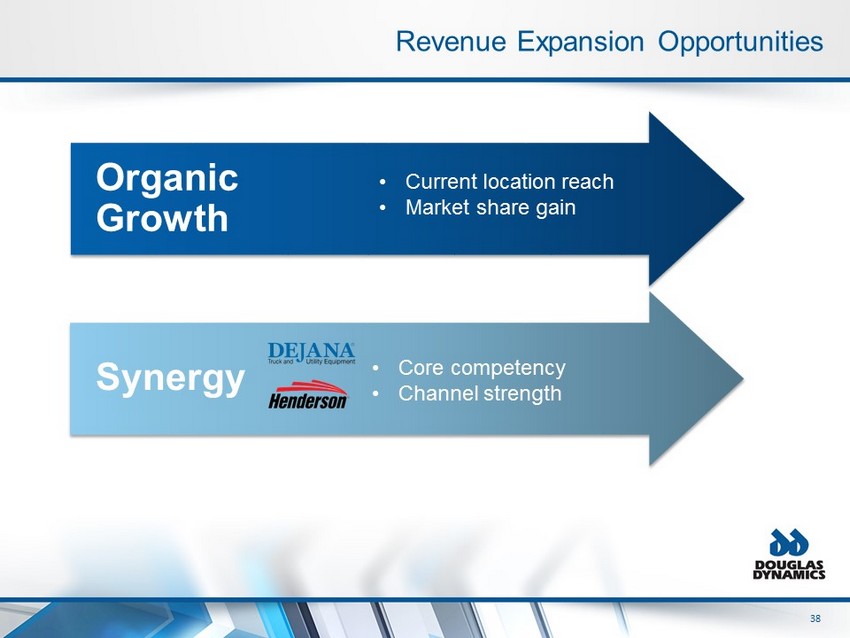
38 38 Revenue Expansion Opportunities Organic Growth • Current location reach • Market share gain Synergy • Core competency • Channel strength
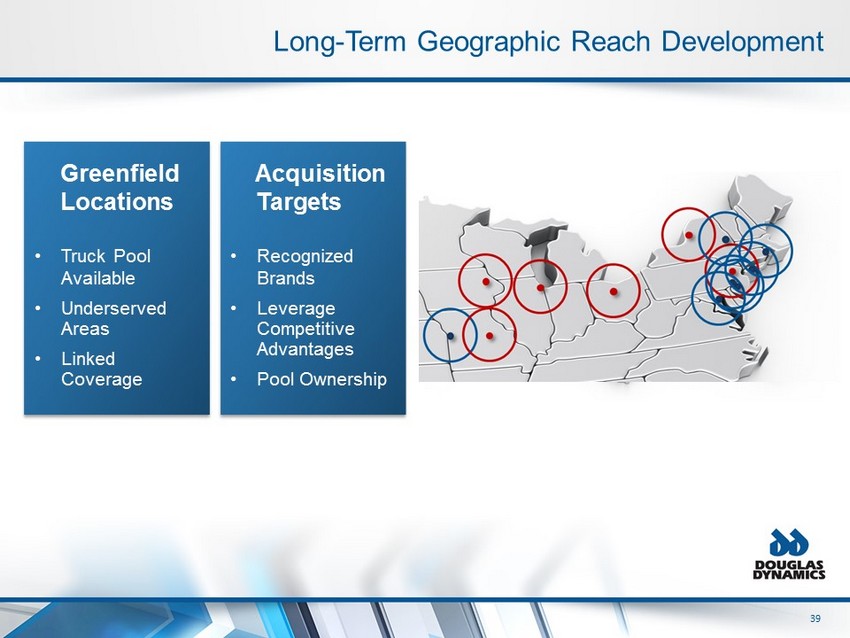
39 39 Long - Term Geographic Reach Development Greenfield Locations • Truck Pool Available • Underserved Areas • Linked Coverage Acquisition Targets • Recognized Brands • Leverage Competitive Advantages • Pool Ownership
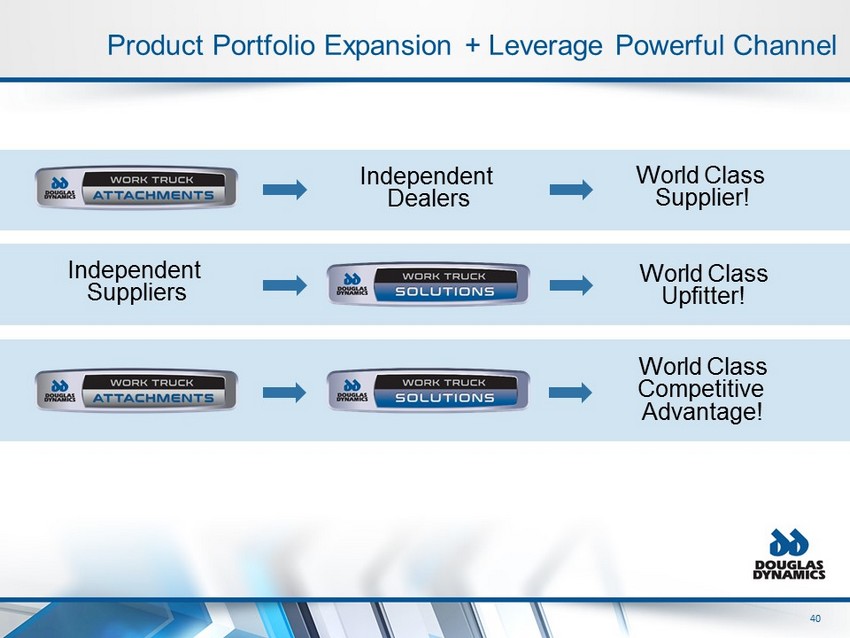
40 40 Independent Suppliers Independent Dealers World Class Supplier! World Class Upfitter! World Class Competitive Advantage! Product Portfolio Expansion + Leverage Powerful Channel
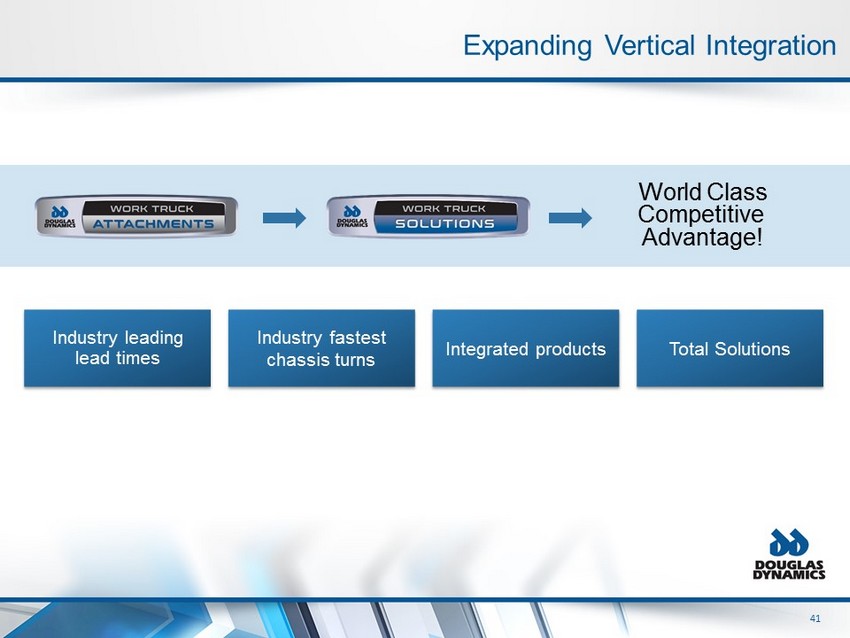
41 41 World Class Competitive Advantage! Industry leading lead times Industry fastest chassis turns Integrated products Total Solutions Expanding Vertical Integration
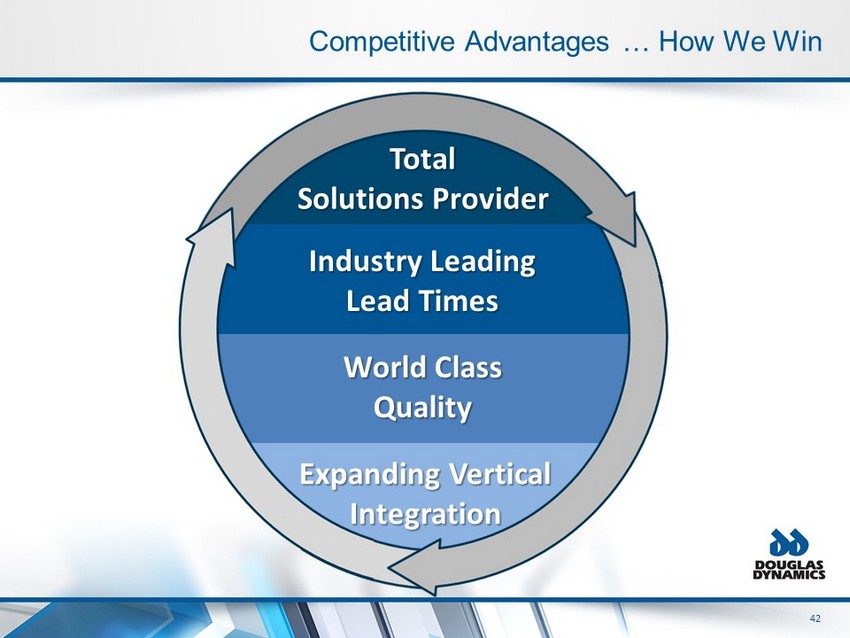
42 42 Total Solutions Provider Industry Leading Lead Times World Class Quality Competitive Advantages … How We Win Expanding Vertical Integration Product Portfolio
Shannan Vlieger – Director of Operational Excellence The Importance of DDMS October 2019
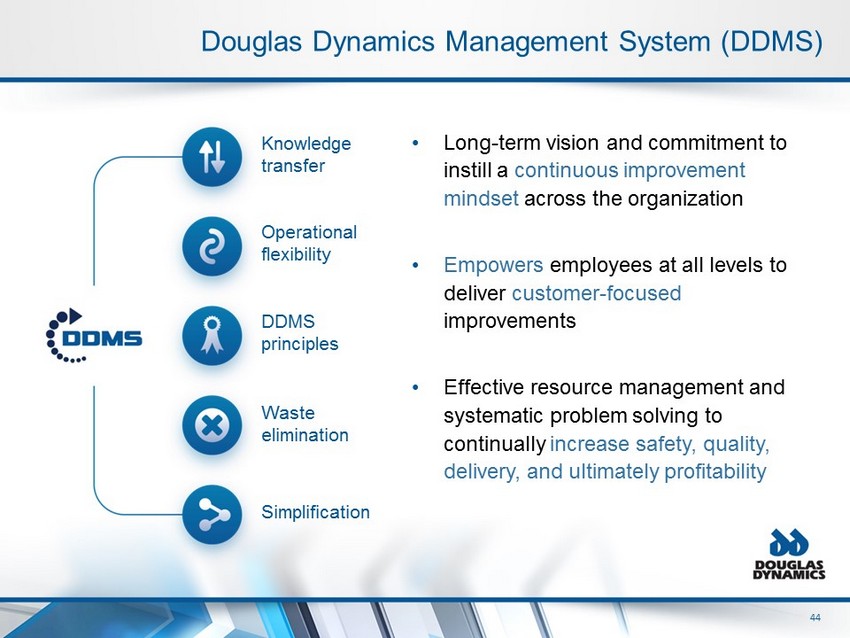
44 44 Douglas Dynamics Management System (DDMS) • Long - term vision and commitment to instill a continuous improvement mindset across the organization • Empowers employees at all levels to deliver customer - focused improvements • Effective resource management and systematic problem solving to continually increase safety, quality, delivery, and ultimately profitability Knowledge transfer Operational flexibility DDMS principles Waste elimination Simplification
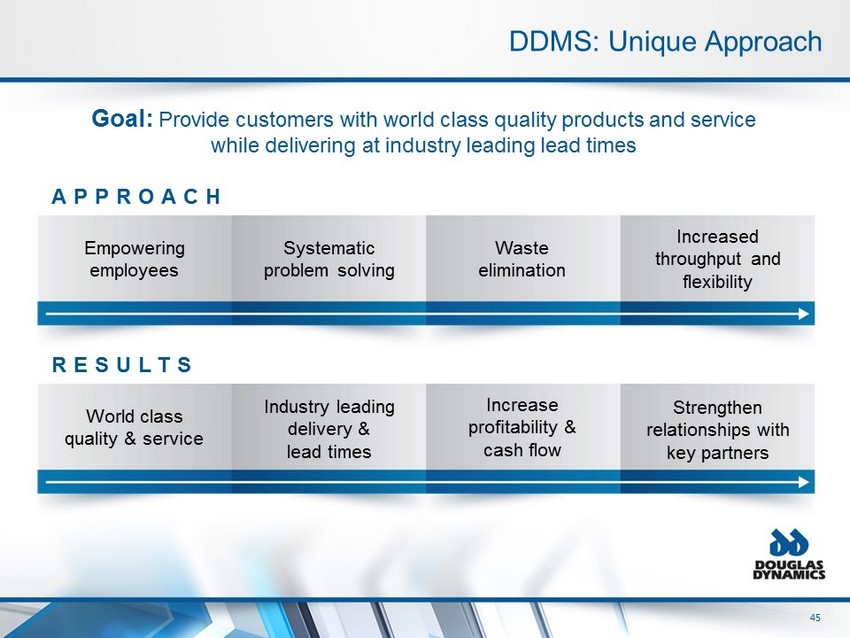
45 45 DDMS: Unique Approach Goal: Provide customers with world class quality products and service while delivering at industry leading lead times APPROACH Empowering employees Systematic problem solving Waste elimination Increased throughput and flexibility RESULTS World class quality & service Industry leading delivery & lead times Increase profitability & cash flow Strengthen relationships with key partners
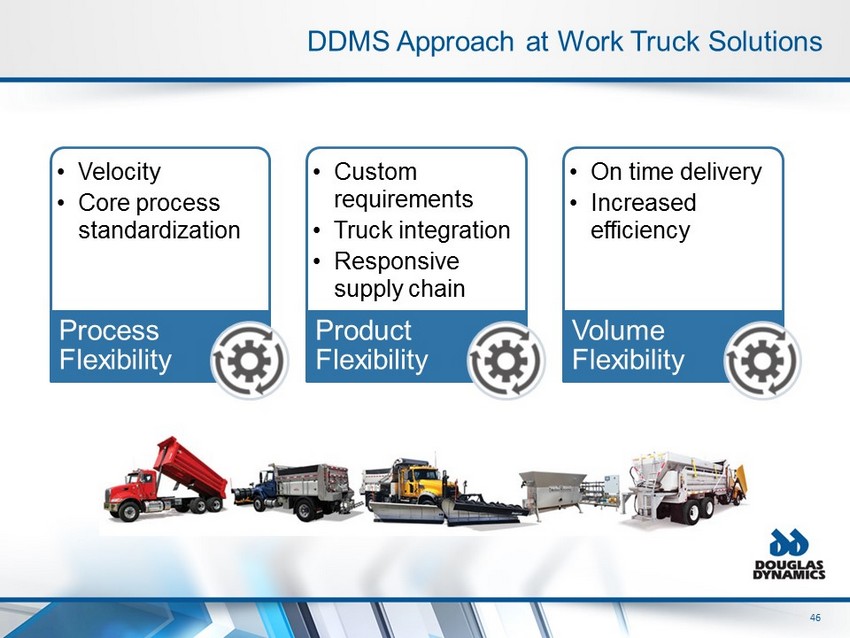
46 46 DDMS Approach at Work Truck Solutions • Velocity • Core process standardization Process Flexibility • Custom requirements • Truck integration • Responsive supply chain Product Flexibility • On time delivery • Increased efficiency Volume Flexibility
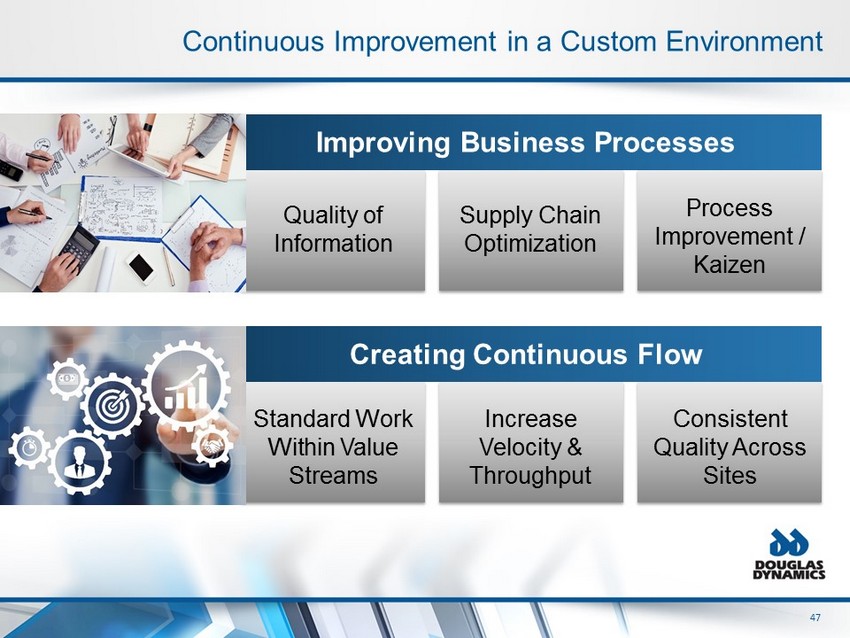
47 47 Continuous Improvement in a Custom Environment Improving Business Processes Process Improvement / Kaizen Supply Chain Optimization Quality of Information Creating Continuous Flow Consistent Quality Across Sites Increase Velocity & Throughput Standard Work Within Value Streams
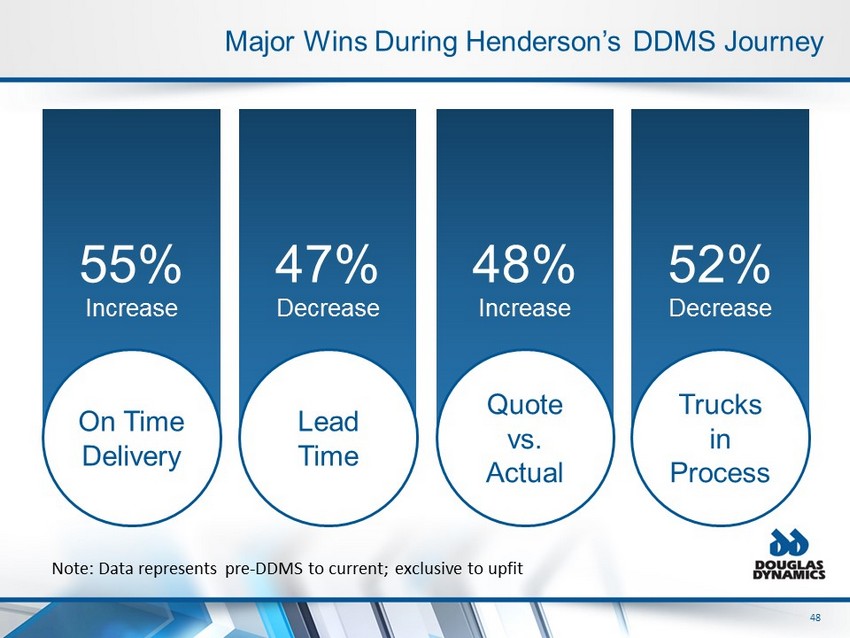
48 48 Major Wins During Henderson’s DDMS Journey 55% Increase 47% Decrease 48% Increase 52% Decrease On Time Delivery Lead Time Quote vs. Actual Trucks in Process Note: Data represents pre - DDMS to current; exclusive to upfit
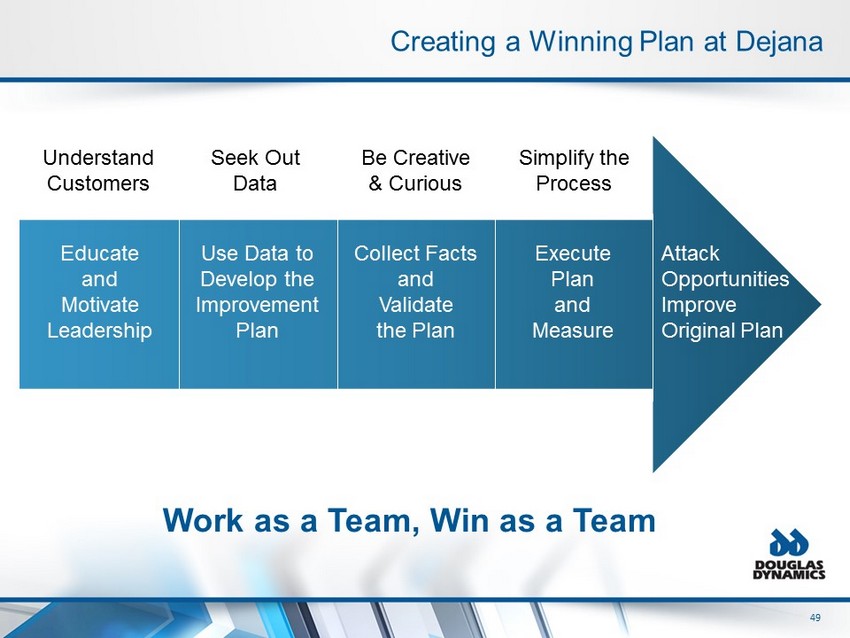
49 49 Creating a Winning Plan at Dejana Work as a Team, Win as a Team Educate and Motivate Leadership Use Data to Develop the Improvement Plan Collect Facts and Validate the Plan Execute Plan and Measure Attack Opportunities Improve Original Plan Understand Customers Seek Out Data Be Creative & Curious Simplify the Process
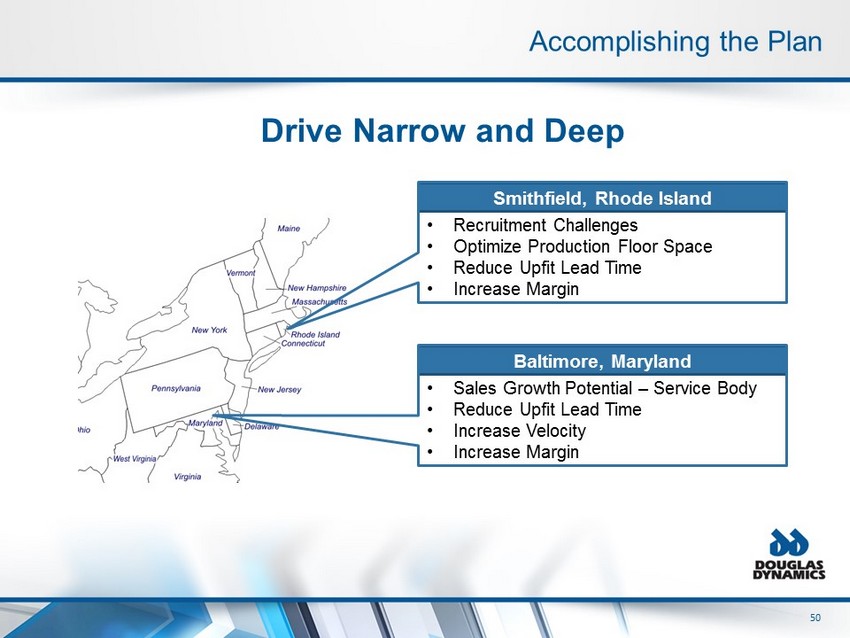
50 50 Accomplishing the Plan Smithfield, Rhode Island • Recruitment Challenges • Optimize Production Floor Space • Reduce Upfit Lead Time • Increase Margin Baltimore, Maryland • Sales Growth Potential – Service Body • Reduce Upfit Lead Time • Increase Velocity • Increase Margin Drive Narrow and Deep
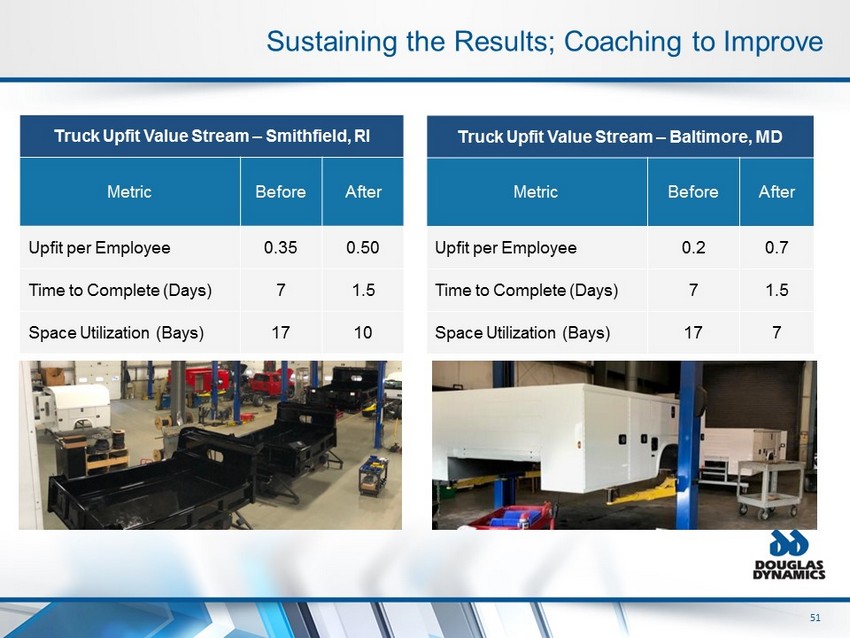
51 51 Sustaining the Results; Coaching to Improve Truck Upfit Value Stream – Smithfield, RI Metric Before After Upfit per Employee 0.35 0.50 Time to Complete (Days) 7 1.5 Space Utilization (Bays) 17 10 Truck Upfit Value Stream – Baltimore, MD Metric Before After Upfit per Employee 0.2 0.7 Time to Complete (Days) 7 1.5 Space Utilization (Bays) 17 7
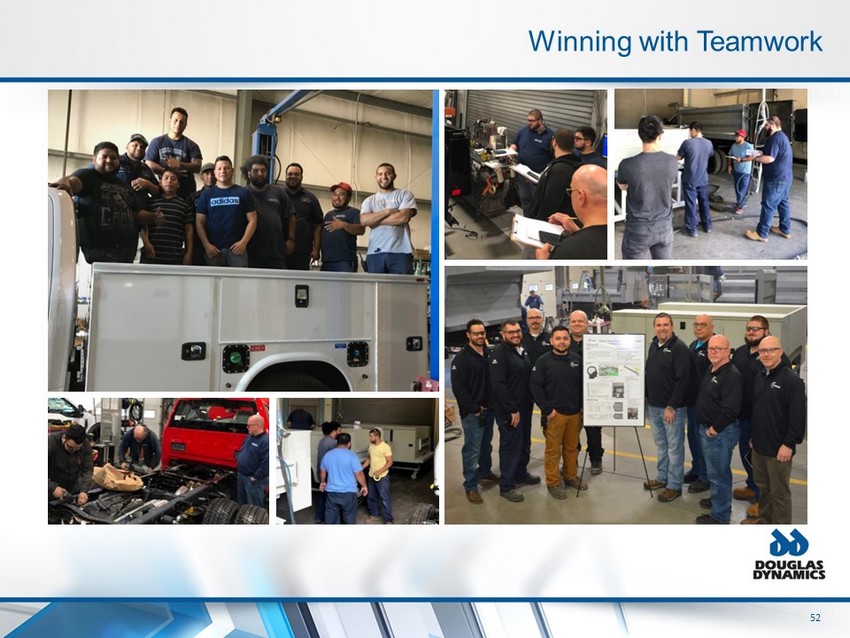
52 52 Winning with Teamwork
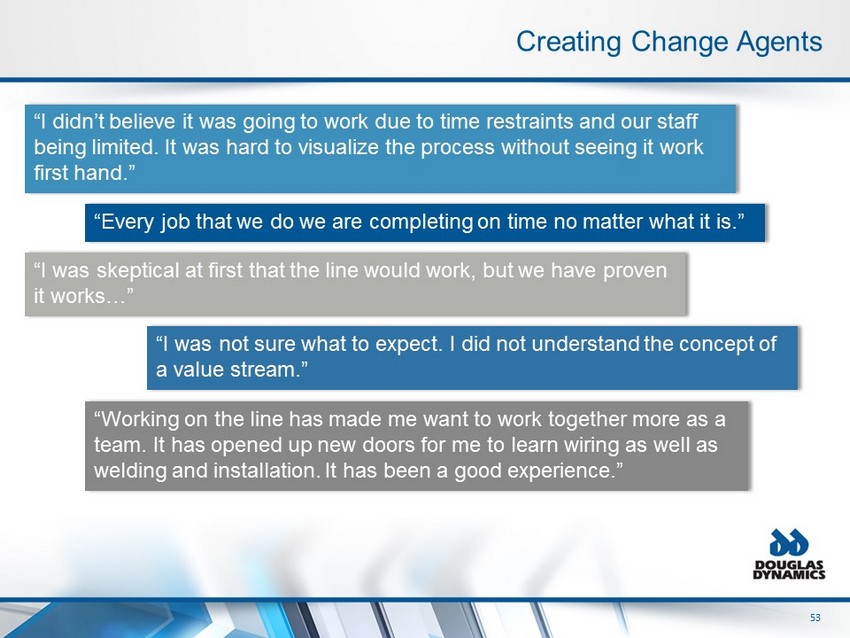
53 53 “I didn’t believe it was going to work due to time restraints and our staff being limited. It was hard to visualize the process without seeing it work first hand.” Creating Change Agents “I was skeptical at first that the line would work, but we have proven it works…” “Every job that we do we are completing on time no matter what it is.” “I was not sure what to expect. I did not understand the concept of a value stream.” “Working on the line has made me want to work together more as a team. It has opened up new doors for me to learn wiring as well as welding and installation. It has been a good experience.”
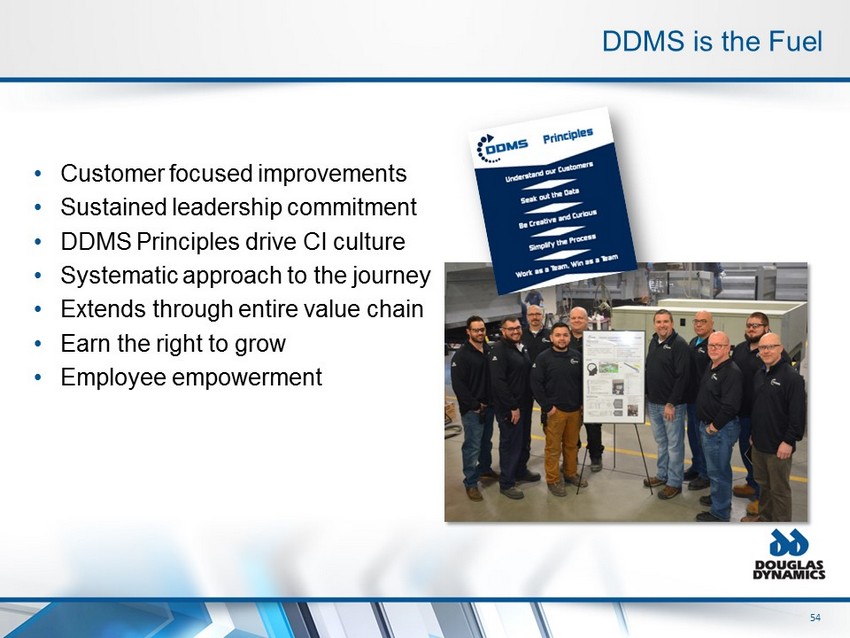
54 54 DDMS is the Fuel • Customer focused improvements • Sustained leadership commitment • DDMS Principles drive CI culture • Systematic approach to the journey • Extends through entire value chain • Earn the right to grow • Employee empowerment
55 55 Total Solutions Provider Industry Leading Lead Times World Class Quality Expanding Vertical Integration Competitive Advantages … How We Win
Evolving Talent Strategy October 2019 Linda Evans – Vice President of HR Jesse Pilachowski – Director of Organizational Development
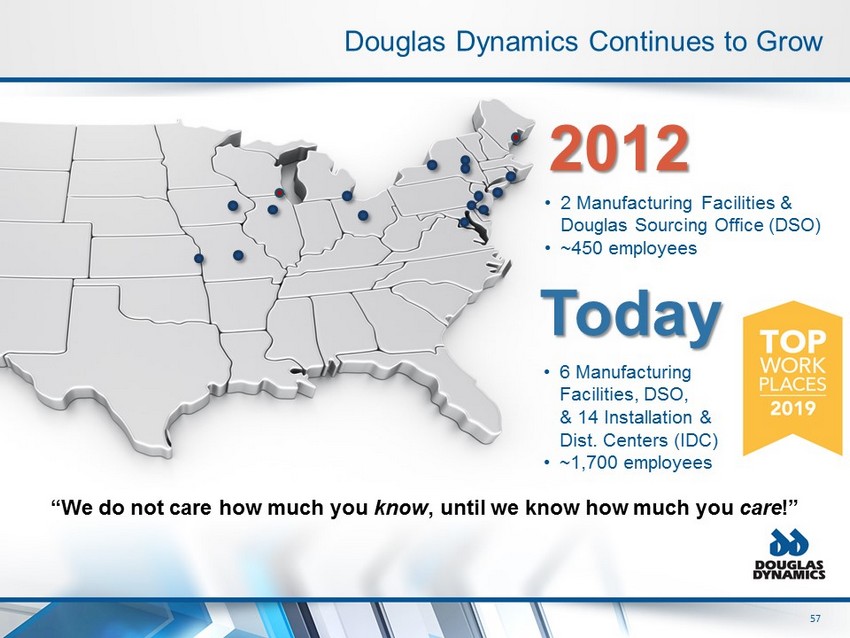
57 57 Douglas Dynamics Continues to Grow “We do not care how much you know , until we know how much you care !” 2012 • 2 Manufacturing Facilities & Douglas Sourcing Office (DSO) • ~450 employees Today • 6 Manufacturing Facilities, DSO, & 14 Installation & Dist. Centers (IDC) • ~1,700 employees
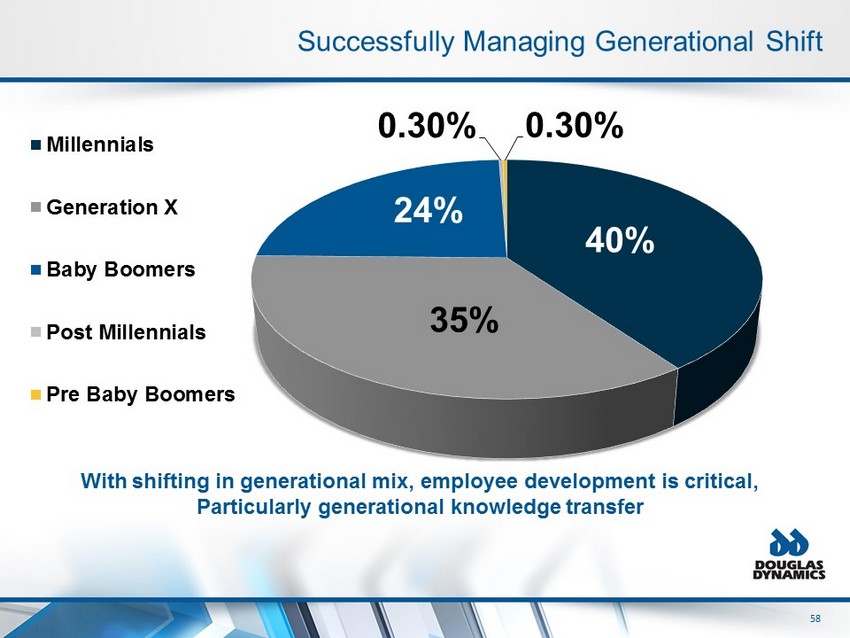
58 58 Successfully Managing Generational Shift 40% 35% 24% 0.30% 0.30% Millennials Generation X Baby Boomers Post Millennials Pre Baby Boomers With shifting in generational mix, employee development is critical, Particularly generational knowledge transfer
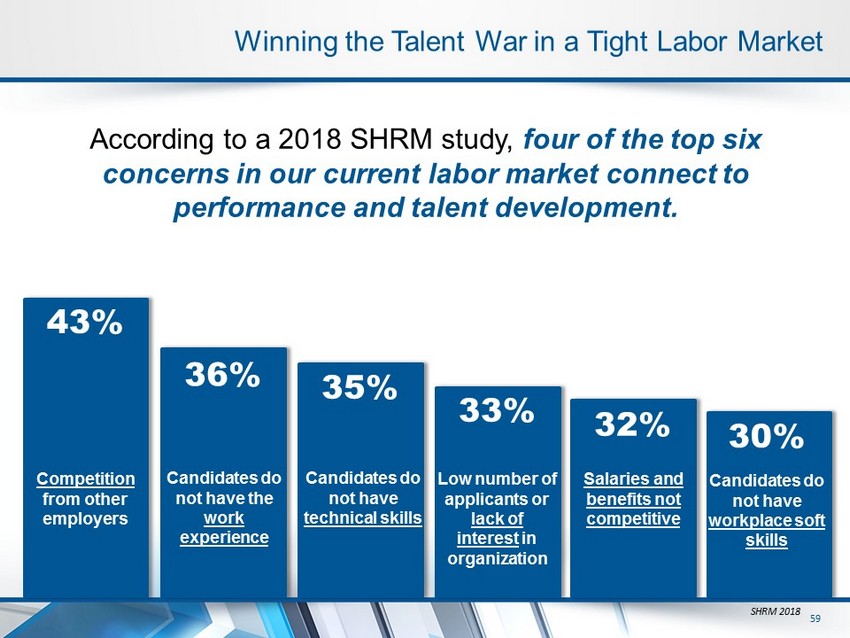
59 59 Winning the Talent War in a Tight Labor Market According to a 2018 SHRM study, four of the top six concerns in our current labor market connect to performance and talent development. 43% 36% 35% 33% 32% 30% Competition from other employers Candidates do not have the work experience Candidates do not have technical skills Low number of applicants or lack of interest in organization Salaries and benefits not competitive Candidates do not have workplace soft skills SHRM 2018
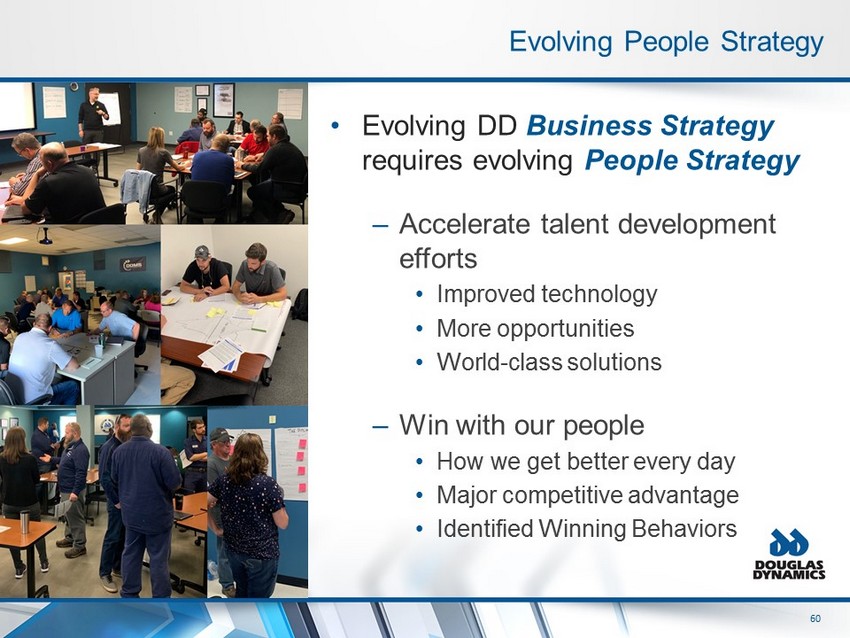
60 60 Evolving People Strategy • Evolving DD Business Strategy requires evolving People Strategy – Accelerate talent development efforts • Improved technology • More opportunities • World - class solutions – Win with our people • How we get better every day • Major competitive advantage • Identified Winning Behaviors
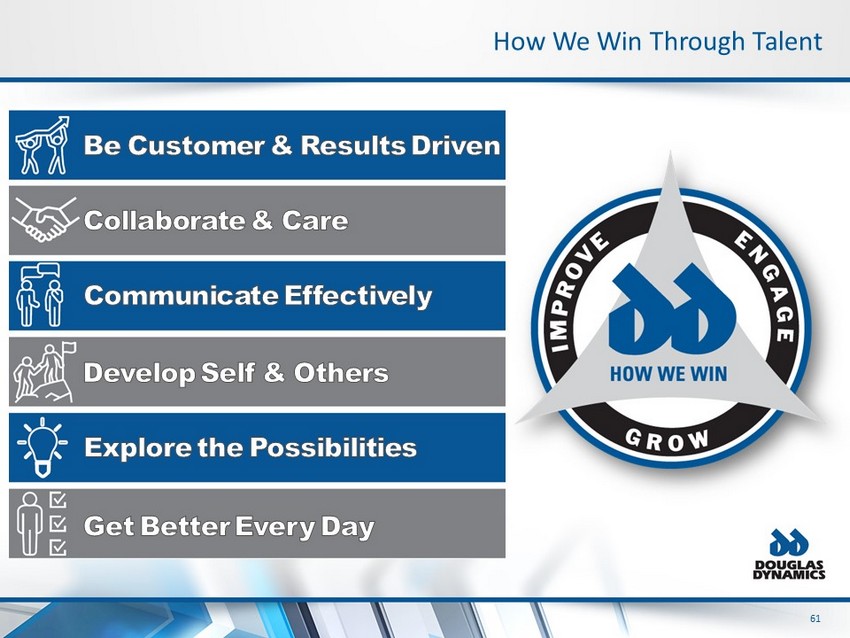
61 61 How We Win Through Talent
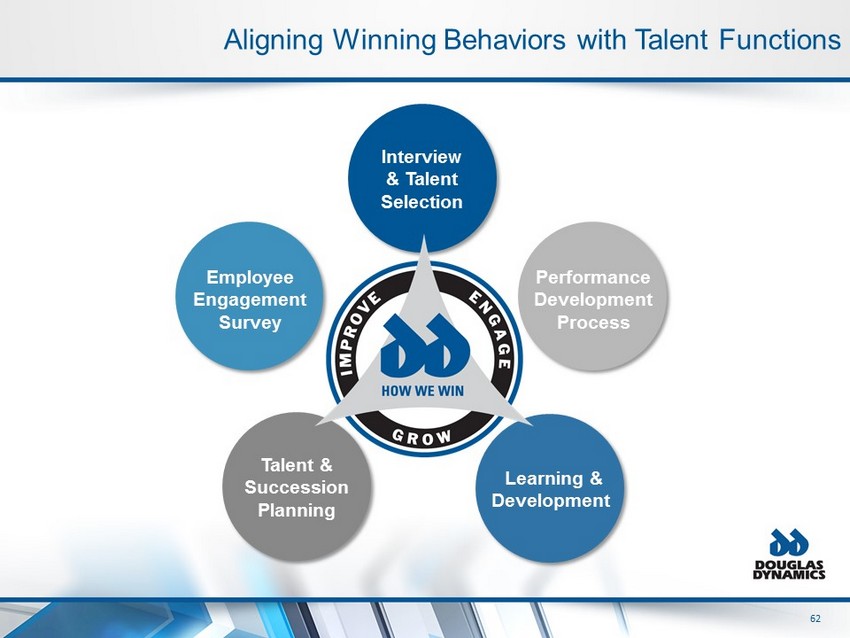
62 62 Aligning Winning Behaviors with Talent Functions Interview & Talent Selection Performance Development Process Learning & Development Employee Engagement Survey Talent & Succession Planning
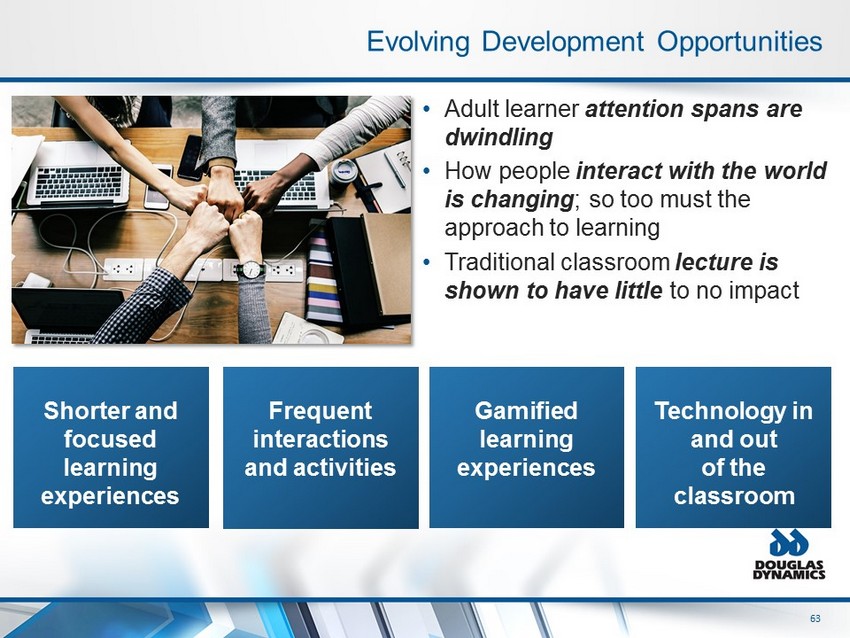
63 63 Evolving Development Opportunities • Adult learner attention spans are dwindling • How people interact with the world is changing ; so too must the approach to learning • Traditional classroom lecture is shown to have little to no impact Shorter and focused learning experiences Frequent interactions and activities Gamified learning experiences Technology in and out of the classroom
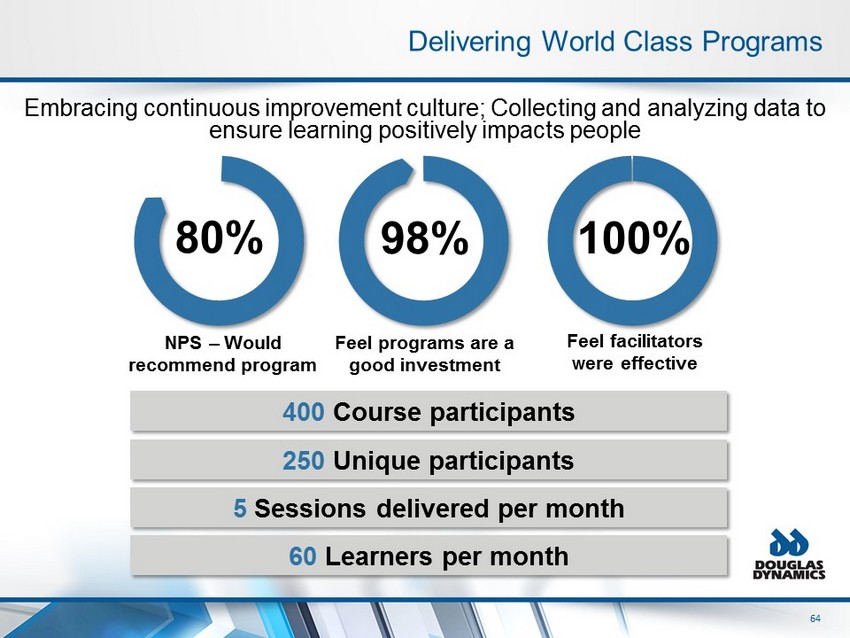
64 64 Delivering World Class Programs 400 Course participants 250 Unique participants 5 Sessions delivered per month 60 Learners per month NPS – Would recommend program Feel programs are a good investment Feel facilitators were effective 80% 98% 100% Embracing continuous improvement culture; Collecting and analyzing data to ensure learning positively impacts people
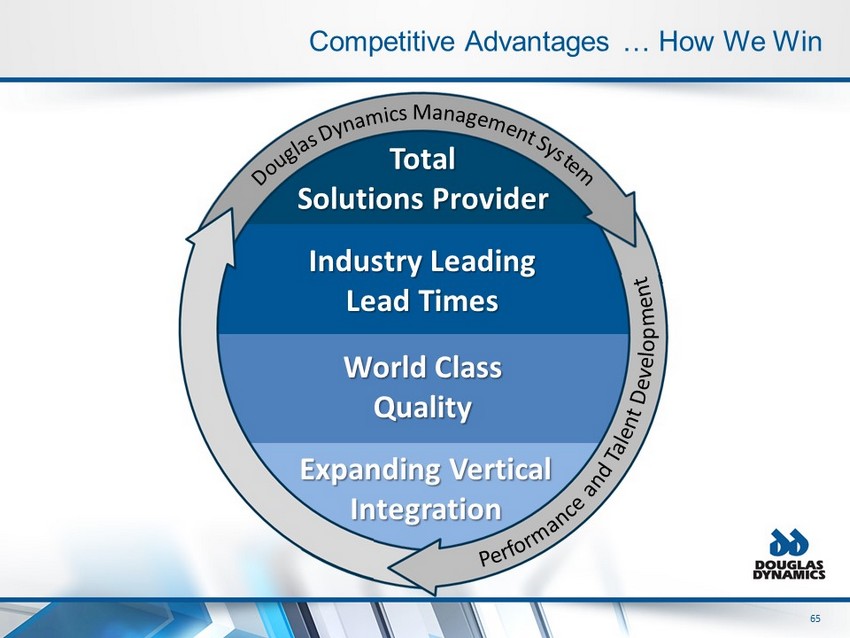
65 65 Total Solutions Provider Industry Leading Lead Times World Class Quality Expanding Vertical Integration Competitive Advantages … How We Win

Financial Strength & Flexibility – October 2019 Sarah Lauber – CFO
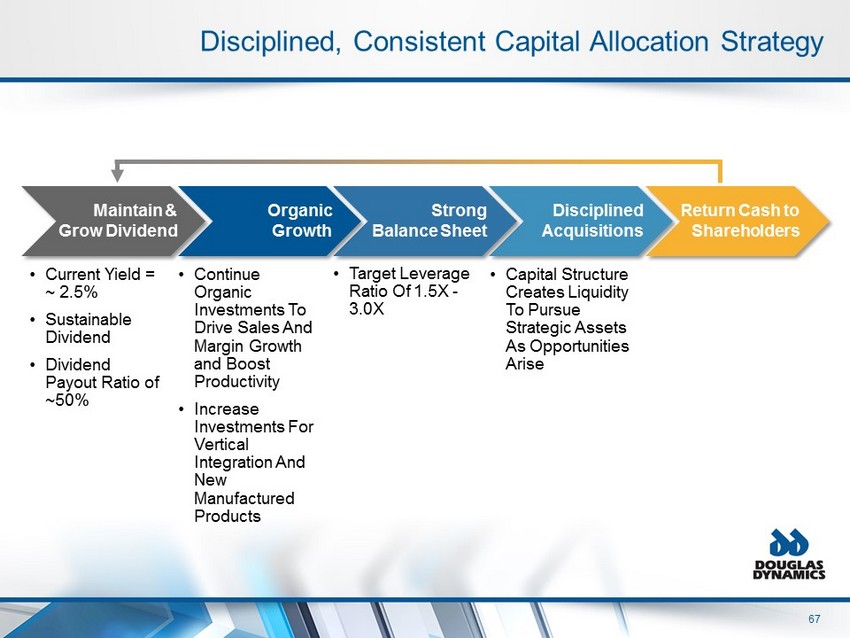
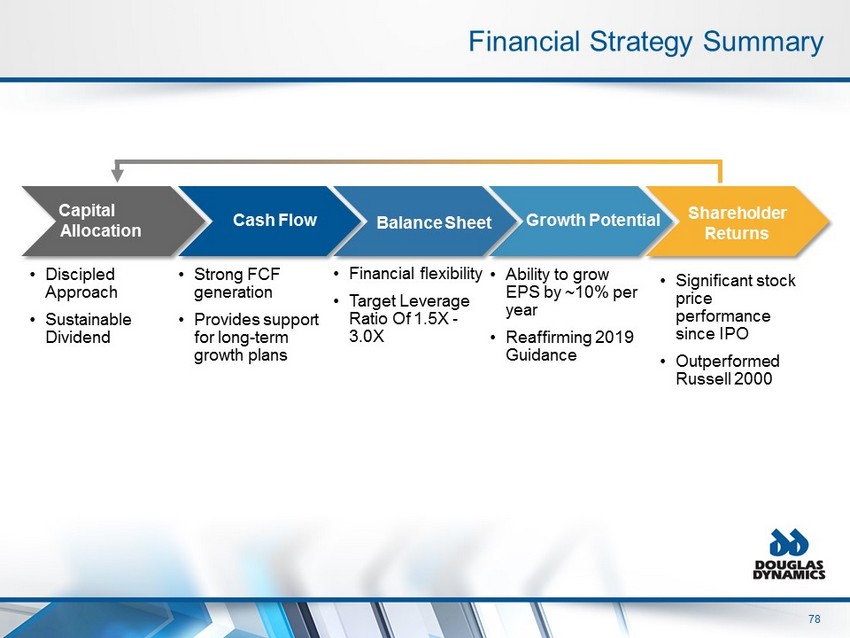
67 Disciplined, Consistent Capital Allocation Strategy • Current Yield = ~ 2.5% • Sustainable Dividend • Dividend Payout Ratio of ~50% • Target Leverage Ratio Of 1.5X - 3.0X • Continue Organic Investments To Drive Sales And Margin Growth and Boost Productivity • Increase Investments For Vertical Integration And New Manufactured Products • Capital Structure Creates Liquidity To Pursue Strategic Assets As Opportunities Arise Maintain & Grow Dividend Organic Growth Strong Balance Sheet Disciplined Acquisitions Return Cash to Shareholders
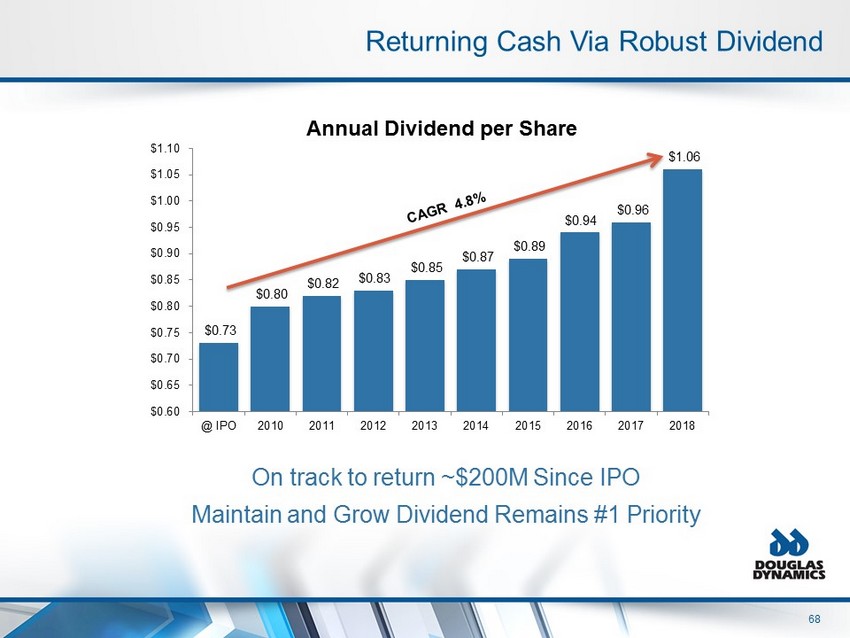
68 Returning Cash Via Robust Dividend On track to return ~$200M Since IPO Maintain and Grow Dividend Remains #1 Priority $0.73 $0.80 $0.82 $0.83 $0.85 $0.87 $0.89 $0.94 $0.96 $1.06 $0.60 $0.65 $0.70 $0.75 $0.80 $0.85 $0.90 $0.95 $1.00 $1.05 $1.10 @ IPO 2010 2011 2012 2013 2014 2015 2016 2017 2018 Annual Dividend per Share
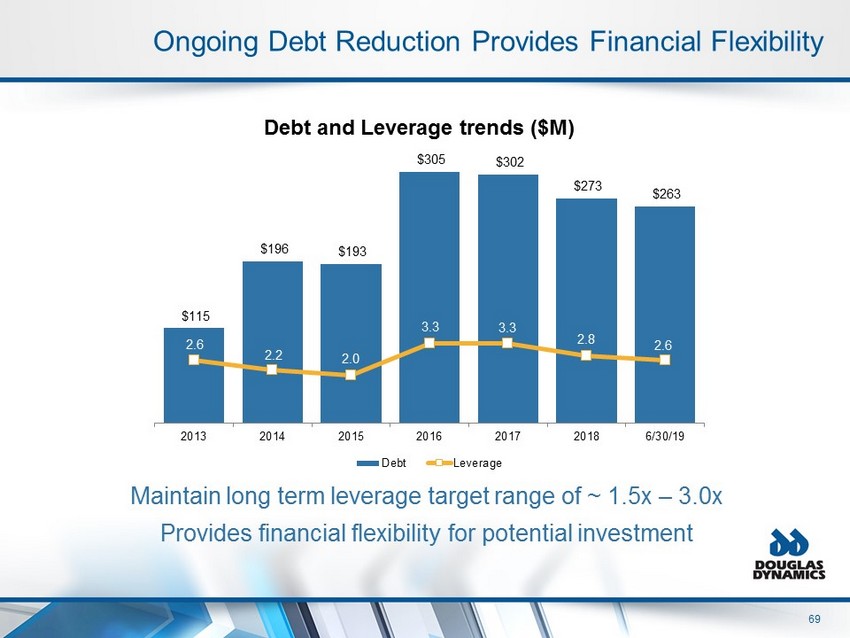
69 Ongoing Debt Reduction Provides Financial Flexibility Maintain long term leverage target range of ~ 1.5x – 3.0x Provides financial flexibility for potential investment $115 $196 $193 $305 $302 $273 $263 2.6 2.2 2.0 3.3 3.3 2.8 2.6 2013 2014 2015 2016 2017 2018 6/30/19 Debt and Leverage trends ($M) Debt Leverage
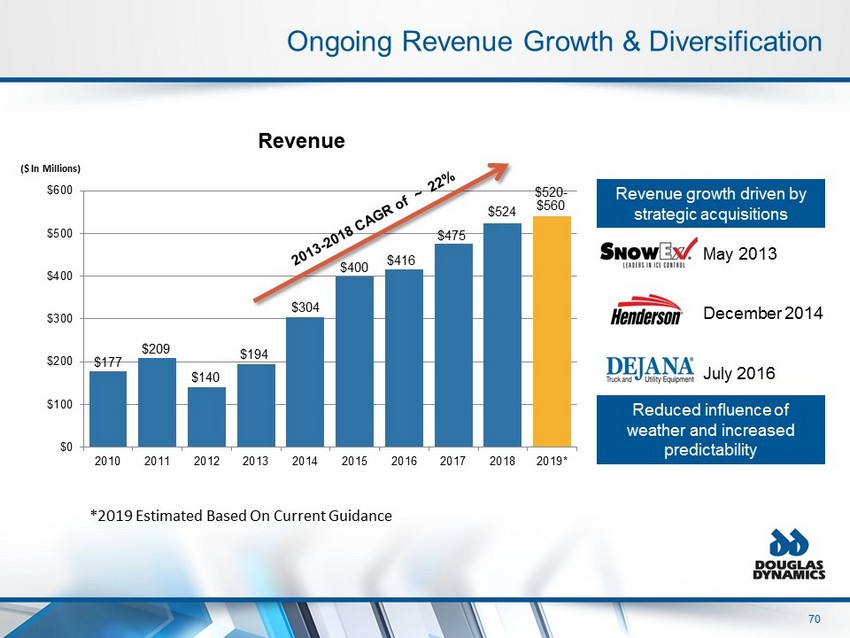
70 $177 $209 $140 $194 $304 $400 $416 $475 $524 $0 $100 $200 $300 $400 $500 $600 2010 2011 2012 2013 2014 2015 2016 2017 2018 2019* Revenue ($ In Millions) Revenue growth driven by strategic acquisitions May 2013 December 2014 July 2016 Ongoing Revenue Growth & Diversification Reduced influence of weather and increased predictability *2019 Estimated Based On Current Guidance $520 - $560
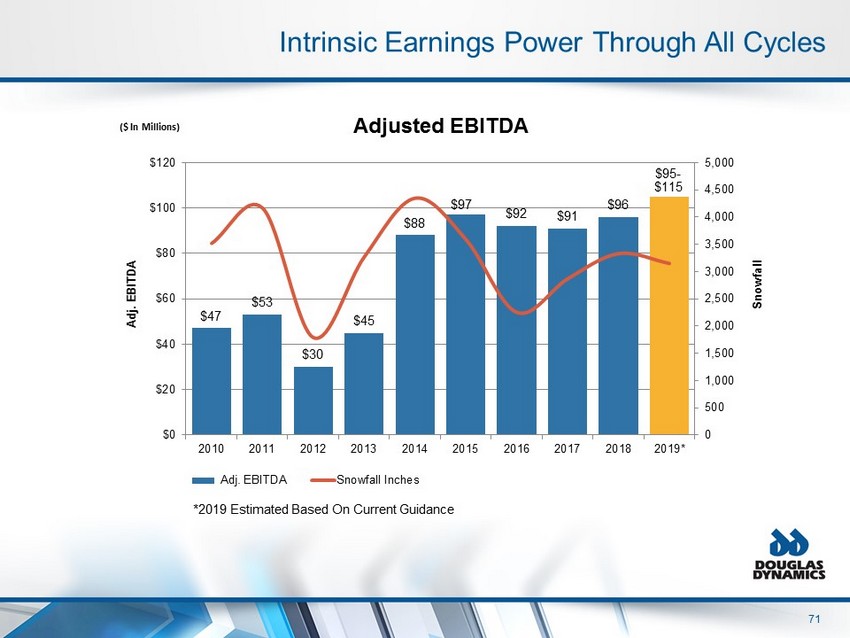
71 $47 $53 $30 $45 $88 $97 $92 $91 $96 0 500 1,000 1,500 2,000 2,500 3,000 3,500 4,000 4,500 5,000 $0 $20 $40 $60 $80 $100 $120 2010 2011 2012 2013 2014 2015 2016 2017 2018 2019* Adj. EBITDA Snowfall Adjusted EBITDA Adj. EBITDA Snowfall Inches ($ In Millions) *2019 Estimated Based On Current Guidance Intrinsic Earnings Power Through All Cycles $95 - $115
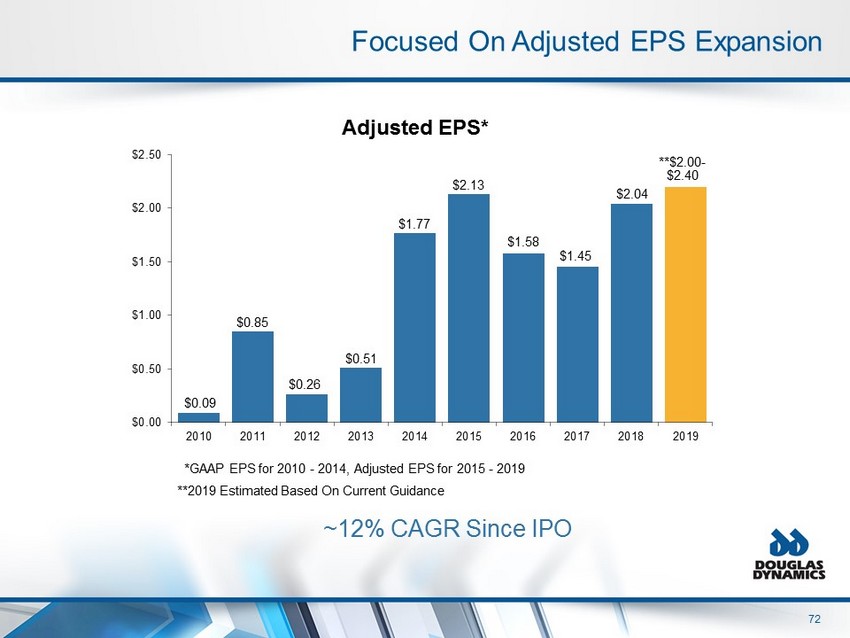
72 $0.09 $0.85 $0.26 $0.51 $1.77 $2.13 $1.58 $1.45 $2.04 $0.00 $0.50 $1.00 $1.50 $2.00 $2.50 2010 2011 2012 2013 2014 2015 2016 2017 2018 2019 *GAAP EPS for 2010 - 2014, Adjusted EPS for 2015 - 2019 **2019 Estimated Based On Current Guidance Adjusted EPS* Focused On Adjusted EPS Expansion ~12% CAGR Since IPO **$2.00 - $2.40
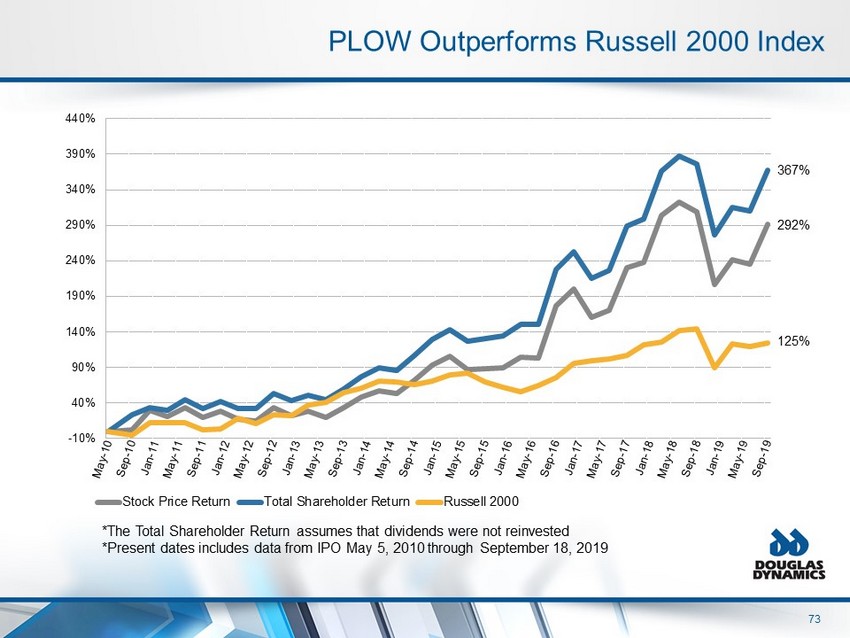
73 PLOW Outperforms Russell 2000 Index -10% 40% 90% 140% 190% 240% 290% 340% 390% 440% Stock Price Return Total Shareholder Return Russell 2000 *The Total Shareholder Return assumes that dividends were not reinvested *Present dates includes data from IPO May 5, 2010 through September 18, 2019 367% 292% 125%
74 How We Win Price Leadership Best Cost Free Cash Flow World Class Quality Industry Leading Lead Times DDMS Global Sourcing Ability To Invest Back Into Businesses Work Truck Solutions Work Truck Attachments DDMS
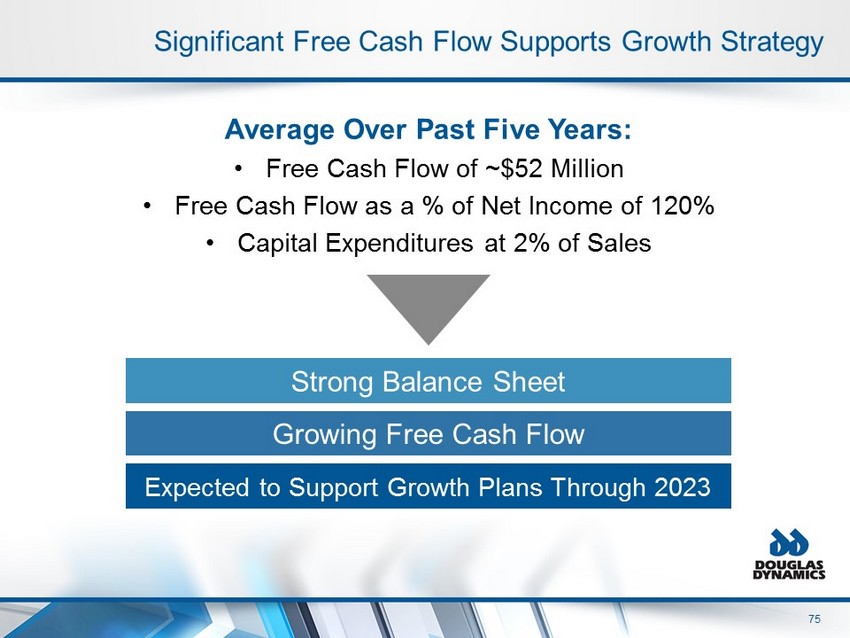
75 Significant Free Cash Flow Supports Growth Strategy Average Over Past Five Years: • Free Cash Flow of ~$52 Million • Free Cash Flow as a % of Net Income of 120% • Capital Expenditures at 2% of Sales Strong Balance Sheet Growing Free Cash Flow Expected to Support Growth Plans Through 2023
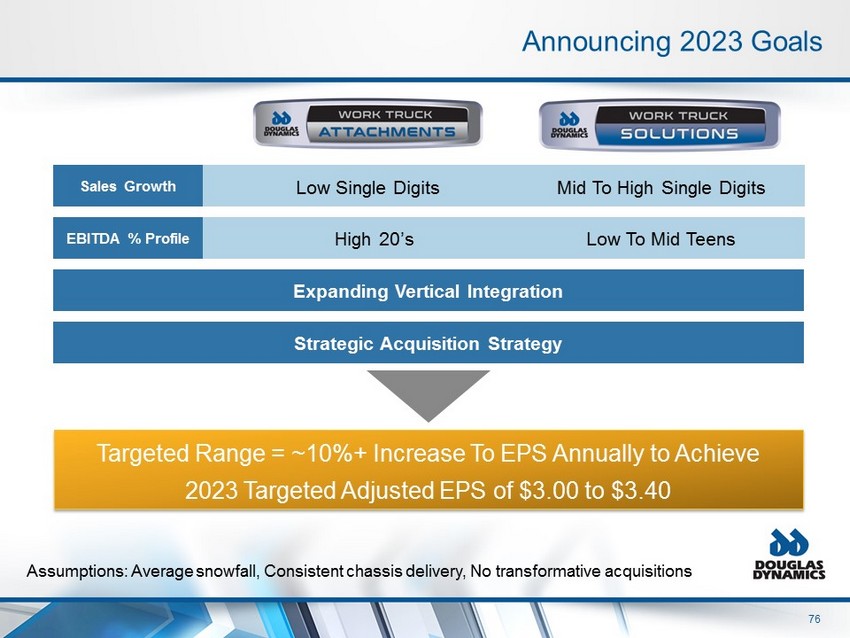
76 Announcing 2023 Goals Low Single Digits Mid To High Single Digits High 20’s Low To Mid Teens Targeted Range = ~10%+ Increase To EPS Annually to Achieve 2023 Targeted Adjusted EPS of $3.00 to $3.40 Assumptions: Average snowfall, Consistent chassis delivery, No transformative acquisitions Sales Growth EBITDA % Profile Expanding Vertical Integration Strategic Acquisition Strategy
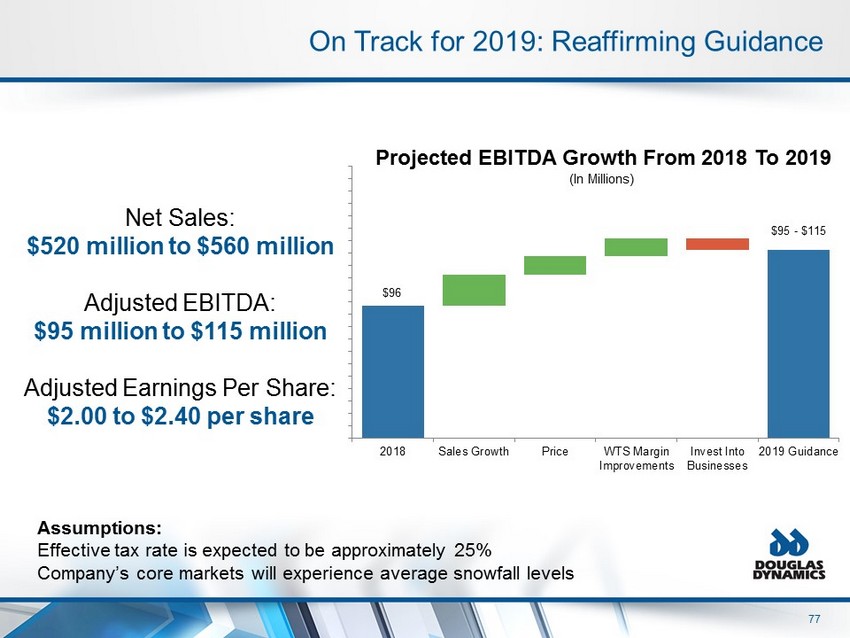
77 On Track for 2019: Reaffirming Guidance Net Sales: $520 million to $560 million Adjusted EBITDA: $95 million to $115 million Adjusted Earnings Per Share: $2.00 to $2.40 per share (In Millions) $96 $95 - $115 2018 Sales Growth Price WTS Margin Improvements Invest Into Businesses 2019 Guidance Projected EBITDA Growth From 2018 To 2019 Assumptions: Effective tax rate is expected to be approximately 25% Company’s core markets will experience average snowfall levels
78 Financial Strategy Summary • Discipled Approach • Sustainable Dividend • Financial flexibility • Target Leverage Ratio Of 1.5X - 3.0X • Strong FCF generation • Provides support for long - term growth plans • Ability to grow EPS by ~10% per year • Reaffirming 2019 Guidance Capital Allocation Cash Flow Balance Sheet Growth Potential Shareholder Returns • Significant stock price performance since IPO • Outperformed Russell 2000
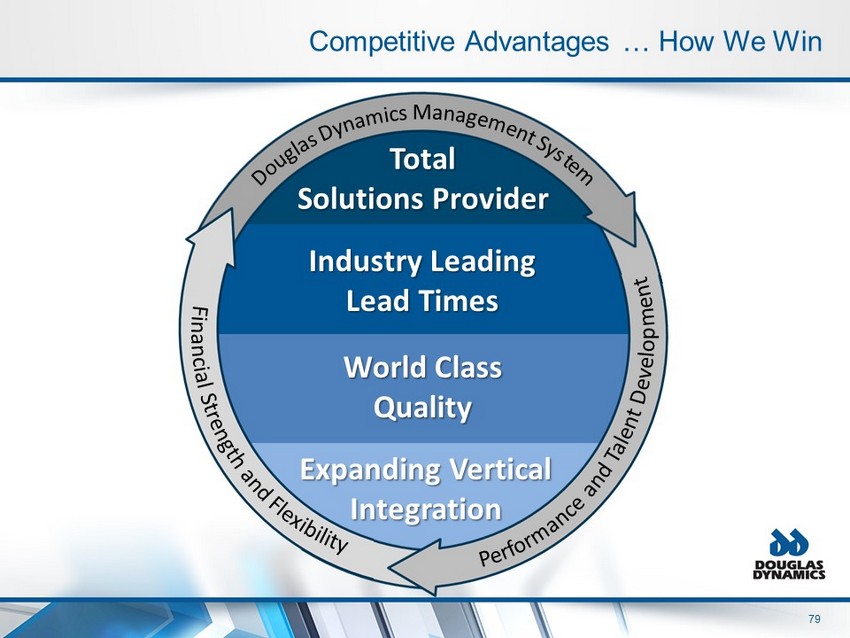
79 Total Solutions Provider Industry Leading Lead Times World Class Quality Expanding Vertical Integration Competitive Advantages … How We Win

Investor Event October 2019