0001287213
DOUGLAS DYNAMICS, INC
false
--12-31
FY
2022
0.01
0.01
200,000,000
200,000,000
22,886,793
22,886,793
22,980,951
22,980,951
176
120
34
3,140
1,370
899
193
34
899
120
1,370
176
3,140
15
2
16,089
0
0
0
16
2
12
2
113,132
2
2
2
0
2
1
2
387
499
0
1
1
2
1
1
5
2019 2020 2021
2018 2019 2020 2021
12
10
2031
2030
2029
1
1
3
2
Reflects expenses and accrual reversals for one time, unrelated legal, severance, restructuring and consulting fees for the periods presented.
Reflects $17 in reversal of earnout compensation related to Henderson, and $2,000 in reversal of earnout compensation related to Dejana in the year ended December 31, 2020.
Valuation models are calibrated to initial trade price. Subsequent valuations are based on observable inputs to the valuation model (e.g. interest rates and credit spreads). Model inputs are changed only when corroborated by market data. A credit risk adjustment is made on each swap using observable market credit spreads. Thus, inputs used to determine fair value of the interest rate swap are Level 2 inputs. Interest rate swaps of $4,120 and $2,919 at December 31, 2022 are included in Prepaid and other current assets and Other long-term assets, respectively. Interest rate swaps of $3,479 and $2,949 at December 31, 2021 are included in Accrued expenses and other current liabilities and Other long-term liabilities, respectively.
Included in Non-qualified benefit plan assets is the cash surrender value of insurance policies on various individuals that are associated with the Company. The carrying amounts of these insurance policies approximates their fair value.
Reflects incremental costs incurred related to the COVID-19 pandemic for the periods presented. Such COVID-19 related costs include increased expenses directly related to the pandemic, and do not include either production related overhead inefficiencies or lost or deferred sales.
The fair value of the Company’s long-term debt, including current maturities, is based on rates for instruments with comparable maturities and credit quality (Level 2 inputs), and approximates its carrying value. Long-term debt is recorded at carrying amount, net of discount and deferred financing costs, as disclosed on the face of the balance sheet.
These components are included in the computation of benefit plan costs in Note 13.
00012872132022-01-012022-12-31
iso4217:USD
00012872132022-06-30
xbrli:shares
00012872132023-02-21
thunderdome:item
00012872132022-12-31
00012872132021-12-31
iso4217:USDxbrli:shares
00012872132021-01-012021-12-31
00012872132020-01-012020-12-31
0001287213us-gaap:CommonStockMember2019-12-31
0001287213us-gaap:AdditionalPaidInCapitalMember2019-12-31
0001287213us-gaap:RetainedEarningsMember2019-12-31
0001287213us-gaap:AccumulatedOtherComprehensiveIncomeMember2019-12-31
00012872132019-12-31
0001287213us-gaap:CommonStockMember2020-01-012020-12-31
0001287213us-gaap:AdditionalPaidInCapitalMember2020-01-012020-12-31
0001287213us-gaap:RetainedEarningsMember2020-01-012020-12-31
0001287213us-gaap:AccumulatedOtherComprehensiveIncomeMember2020-01-012020-12-31
0001287213us-gaap:AccountingStandardsUpdate201613Member2020-01-012020-12-31
0001287213us-gaap:AccountingStandardsUpdate201613Memberus-gaap:CommonStockMember2019-12-31
0001287213us-gaap:AccountingStandardsUpdate201613Memberus-gaap:AdditionalPaidInCapitalMember2019-12-31
0001287213us-gaap:AccountingStandardsUpdate201613Memberus-gaap:RetainedEarningsMember2019-12-31
0001287213us-gaap:AccountingStandardsUpdate201613Memberus-gaap:AccumulatedOtherComprehensiveIncomeMember2019-12-31
0001287213us-gaap:AccountingStandardsUpdate201613Member2019-12-31
0001287213us-gaap:CommonStockMember2020-12-31
0001287213us-gaap:AdditionalPaidInCapitalMember2020-12-31
0001287213us-gaap:RetainedEarningsMember2020-12-31
0001287213us-gaap:AccumulatedOtherComprehensiveIncomeMember2020-12-31
00012872132020-12-31
0001287213us-gaap:CommonStockMember2021-01-012021-12-31
0001287213us-gaap:AdditionalPaidInCapitalMember2021-01-012021-12-31
0001287213us-gaap:RetainedEarningsMember2021-01-012021-12-31
0001287213us-gaap:AccumulatedOtherComprehensiveIncomeMember2021-01-012021-12-31
0001287213us-gaap:CommonStockMember2021-12-31
0001287213us-gaap:AdditionalPaidInCapitalMember2021-12-31
0001287213us-gaap:RetainedEarningsMember2021-12-31
0001287213us-gaap:AccumulatedOtherComprehensiveIncomeMember2021-12-31
0001287213us-gaap:CommonStockMember2022-01-012022-12-31
0001287213us-gaap:AdditionalPaidInCapitalMember2022-01-012022-12-31
0001287213us-gaap:RetainedEarningsMember2022-01-012022-12-31
0001287213us-gaap:AccumulatedOtherComprehensiveIncomeMember2022-01-012022-12-31
0001287213us-gaap:CommonStockMember2022-12-31
0001287213us-gaap:AdditionalPaidInCapitalMember2022-12-31
0001287213us-gaap:RetainedEarningsMember2022-12-31
0001287213us-gaap:AccumulatedOtherComprehensiveIncomeMember2022-12-31
xbrli:pure
0001287213us-gaap:AccountingStandardsUpdate201613Membersrt:RestatementAdjustmentMemberplow:WorkTruckAttachmentsMember2022-12-31
0001287213us-gaap:AccountingStandardsUpdate201613Membersrt:RestatementAdjustmentMemberplow:WorkTruckSolutionsMember2022-12-31
0001287213plow:WorkTruckAttachmentsMember2022-12-31
0001287213plow:WorkTruckSolutionsMember2022-12-31
0001287213plow:WorkTruckAttachmentsMember2021-12-31
0001287213plow:WorkTruckSolutionsMember2021-12-31
0001287213plow:WorkTruckAttachmentsMember2022-01-012022-12-31
0001287213plow:WorkTruckSolutionsMember2022-01-012022-12-31
0001287213plow:WorkTruckAttachmentsMember2020-12-31
0001287213plow:WorkTruckAttachmentsMember2021-01-012021-12-31
0001287213plow:WorkTruckSolutionsMember2020-12-31
0001287213plow:WorkTruckSolutionsMember2021-01-012021-12-31
0001287213plow:InterestRateSwapEffectiveMay312019ThroughMay312024Member2022-12-31
0001287213us-gaap:InterestRateSwapMember2022-12-31
0001287213us-gaap:InterestRateSwapMember2022-01-012022-12-31
0001287213us-gaap:InterestRateSwapMember2021-12-31
utr:Y
0001287213plow:LandImprovementsAndBuildingsMembersrt:MinimumMember2022-01-012022-12-31
0001287213plow:LandImprovementsAndBuildingsMembersrt:MaximumMember2022-01-012022-12-31
0001287213us-gaap:LeaseholdImprovementsMember2022-01-012022-12-31
0001287213us-gaap:MachineryAndEquipmentMembersrt:MinimumMember2022-01-012022-12-31
0001287213us-gaap:MachineryAndEquipmentMembersrt:MaximumMember2022-01-012022-12-31
0001287213us-gaap:FurnitureAndFixturesMembersrt:MinimumMember2022-01-012022-12-31
0001287213us-gaap:FurnitureAndFixturesMembersrt:MaximumMember2022-01-012022-12-31
0001287213plow:MobileEquipmentAndOtherMembersrt:MinimumMember2022-01-012022-12-31
0001287213plow:MobileEquipmentAndOtherMembersrt:MaximumMember2022-01-012022-12-31
0001287213plow:MunicipalReportingUnitMember2020-01-012020-12-31
0001287213plow:DejanaReportingUnitMember2020-01-012020-12-31
0001287213us-gaap:DistributionRightsMembersrt:MinimumMember2022-01-012022-12-31
0001287213us-gaap:DistributionRightsMembersrt:MaximumMember2022-01-012022-12-31
0001287213us-gaap:TrademarksMembersrt:MinimumMember2022-01-012022-12-31
0001287213us-gaap:TrademarksMembersrt:MaximumMember2022-01-012022-12-31
0001287213us-gaap:PatentsMembersrt:MinimumMember2022-01-012022-12-31
0001287213us-gaap:PatentsMembersrt:MaximumMember2022-01-012022-12-31
0001287213us-gaap:CustomerRelationshipsMembersrt:MinimumMember2022-01-012022-12-31
0001287213us-gaap:CustomerRelationshipsMembersrt:MaximumMember2022-01-012022-12-31
0001287213us-gaap:NoncompeteAgreementsMembersrt:MinimumMember2022-01-012022-12-31
0001287213us-gaap:NoncompeteAgreementsMembersrt:MaximumMember2022-01-012022-12-31
0001287213us-gaap:TradeNamesMemberplow:DejanaReportingUnitMember2022-12-31
0001287213plow:DejanaReportingUnitMember2022-12-31
0001287213us-gaap:FairValueMeasurementsRecurringMember2022-12-31
0001287213us-gaap:FairValueMeasurementsRecurringMember2021-12-31
0001287213us-gaap:FairValueInputsLevel2Memberus-gaap:FairValueMeasurementsRecurringMember2022-12-31
0001287213us-gaap:FairValueInputsLevel2Memberus-gaap:FairValueMeasurementsRecurringMember2021-12-31
0001287213plow:FleetUpfitSalesMember2022-01-012022-12-31
0001287213plow:FleetUpfitSalesMember2021-01-012021-12-31
0001287213plow:FleetUpfitSalesMember2020-01-012020-12-31
0001287213plow:IndependentDealerMemberplow:WorkTruckAttachmentsMember2022-01-012022-12-31
0001287213plow:IndependentDealerMemberplow:WorkTruckSolutionsMember2022-01-012022-12-31
0001287213plow:IndependentDealerMember2022-01-012022-12-31
0001287213us-gaap:GovernmentContractMemberplow:WorkTruckAttachmentsMember2022-01-012022-12-31
0001287213us-gaap:GovernmentContractMemberplow:WorkTruckSolutionsMember2022-01-012022-12-31
0001287213us-gaap:GovernmentContractMember2022-01-012022-12-31
0001287213plow:FleetMemberplow:WorkTruckAttachmentsMember2022-01-012022-12-31
0001287213plow:FleetMemberplow:WorkTruckSolutionsMember2022-01-012022-12-31
0001287213plow:FleetMember2022-01-012022-12-31
0001287213us-gaap:ProductAndServiceOtherMemberplow:WorkTruckAttachmentsMember2022-01-012022-12-31
0001287213us-gaap:ProductAndServiceOtherMemberplow:WorkTruckSolutionsMember2022-01-012022-12-31
0001287213us-gaap:ProductAndServiceOtherMember2022-01-012022-12-31
0001287213plow:IndependentDealerMemberplow:WorkTruckAttachmentsMember2021-01-012021-12-31
0001287213plow:IndependentDealerMemberplow:WorkTruckSolutionsMember2021-01-012021-12-31
0001287213plow:IndependentDealerMember2021-01-012021-12-31
0001287213us-gaap:GovernmentContractMemberplow:WorkTruckAttachmentsMember2021-01-012021-12-31
0001287213us-gaap:GovernmentContractMemberplow:WorkTruckSolutionsMember2021-01-012021-12-31
0001287213us-gaap:GovernmentContractMember2021-01-012021-12-31
0001287213plow:FleetMemberplow:WorkTruckAttachmentsMember2021-01-012021-12-31
0001287213plow:FleetMemberplow:WorkTruckSolutionsMember2021-01-012021-12-31
0001287213plow:FleetMember2021-01-012021-12-31
0001287213us-gaap:ProductAndServiceOtherMemberplow:WorkTruckAttachmentsMember2021-01-012021-12-31
0001287213us-gaap:ProductAndServiceOtherMemberplow:WorkTruckSolutionsMember2021-01-012021-12-31
0001287213us-gaap:ProductAndServiceOtherMember2021-01-012021-12-31
0001287213plow:IndependentDealerMemberplow:WorkTruckAttachmentsMember2020-01-012020-12-31
0001287213plow:IndependentDealerMemberplow:WorkTruckSolutionsMember2020-01-012020-12-31
0001287213plow:IndependentDealerMember2020-01-012020-12-31
0001287213us-gaap:GovernmentContractMemberplow:WorkTruckAttachmentsMember2020-01-012020-12-31
0001287213us-gaap:GovernmentContractMemberplow:WorkTruckSolutionsMember2020-01-012020-12-31
0001287213us-gaap:GovernmentContractMember2020-01-012020-12-31
0001287213plow:FleetMemberplow:WorkTruckAttachmentsMember2020-01-012020-12-31
0001287213plow:FleetMemberplow:WorkTruckSolutionsMember2020-01-012020-12-31
0001287213plow:FleetMember2020-01-012020-12-31
0001287213us-gaap:ProductAndServiceOtherMemberplow:WorkTruckAttachmentsMember2020-01-012020-12-31
0001287213us-gaap:ProductAndServiceOtherMemberplow:WorkTruckSolutionsMember2020-01-012020-12-31
0001287213us-gaap:ProductAndServiceOtherMember2020-01-012020-12-31
0001287213plow:WorkTruckAttachmentsMember2020-01-012020-12-31
0001287213plow:WorkTruckSolutionsMember2020-01-012020-12-31
0001287213plow:WorkTruckAttachmentsMemberus-gaap:TransferredAtPointInTimeMember2022-01-012022-12-31
0001287213plow:WorkTruckSolutionsMemberus-gaap:TransferredAtPointInTimeMember2022-01-012022-12-31
0001287213us-gaap:TransferredAtPointInTimeMember2022-01-012022-12-31
0001287213plow:WorkTruckAttachmentsMemberus-gaap:TransferredOverTimeMember2022-01-012022-12-31
0001287213plow:WorkTruckSolutionsMemberus-gaap:TransferredOverTimeMember2022-01-012022-12-31
0001287213us-gaap:TransferredOverTimeMember2022-01-012022-12-31
0001287213plow:WorkTruckAttachmentsMemberus-gaap:TransferredAtPointInTimeMember2021-01-012021-12-31
0001287213plow:WorkTruckSolutionsMemberus-gaap:TransferredAtPointInTimeMember2021-01-012021-12-31
0001287213us-gaap:TransferredAtPointInTimeMember2021-01-012021-12-31
0001287213plow:WorkTruckAttachmentsMemberus-gaap:TransferredOverTimeMember2021-01-012021-12-31
0001287213plow:WorkTruckSolutionsMemberus-gaap:TransferredOverTimeMember2021-01-012021-12-31
0001287213us-gaap:TransferredOverTimeMember2021-01-012021-12-31
0001287213plow:WorkTruckAttachmentsMemberus-gaap:TransferredAtPointInTimeMember2020-01-012020-12-31
0001287213plow:WorkTruckSolutionsMemberus-gaap:TransferredAtPointInTimeMember2020-01-012020-12-31
0001287213us-gaap:TransferredAtPointInTimeMember2020-01-012020-12-31
0001287213plow:WorkTruckAttachmentsMemberus-gaap:TransferredOverTimeMember2020-01-012020-12-31
0001287213plow:WorkTruckSolutionsMemberus-gaap:TransferredOverTimeMember2020-01-012020-12-31
0001287213us-gaap:TransferredOverTimeMember2020-01-012020-12-31
0001287213plow:DejanaMember2016-07-15
0001287213plow:DejanaMember2016-07-152016-07-15
0001287213plow:DejanaMember2016-12-31
0001287213plow:DejanaMember2016-01-012016-12-31
0001287213plow:DejanaMember2017-01-012017-12-31
0001287213plow:DejanaMember2017-09-202017-09-20
0001287213plow:DejanaMember2017-09-20
0001287213plow:DejanaMember2017-07-012017-09-30
0001287213plow:DejanaMember2017-10-012017-12-31
0001287213plow:DejanaMember2018-10-012018-12-31
0001287213plow:DejanaMember2019-10-012019-12-31
0001287213plow:DejanaMember2020-04-012020-06-30
0001287213plow:DejanaMember2020-12-31
0001287213us-gaap:LandMember2022-12-31
0001287213us-gaap:LandMember2021-12-31
0001287213us-gaap:LandImprovementsMember2022-12-31
0001287213us-gaap:LandImprovementsMember2021-12-31
0001287213us-gaap:LeaseholdImprovementsMember2022-12-31
0001287213us-gaap:LeaseholdImprovementsMember2021-12-31
0001287213us-gaap:BuildingMember2022-12-31
0001287213us-gaap:BuildingMember2021-12-31
0001287213us-gaap:MachineryAndEquipmentMember2022-12-31
0001287213us-gaap:MachineryAndEquipmentMember2021-12-31
0001287213us-gaap:FurnitureAndFixturesMember2022-12-31
0001287213us-gaap:FurnitureAndFixturesMember2021-12-31
0001287213plow:MobileEquipmentAndOtherMember2022-12-31
0001287213plow:MobileEquipmentAndOtherMember2021-12-31
0001287213us-gaap:ConstructionInProgressMember2022-12-31
0001287213us-gaap:ConstructionInProgressMember2021-12-31
0001287213srt:MinimumMember2022-12-31
0001287213srt:MaximumMember2022-12-31
utr:M
0001287213us-gaap:TrademarksAndTradeNamesMember2022-12-31
0001287213us-gaap:DistributionRightsMember2022-12-31
0001287213us-gaap:CustomerRelationshipsMember2022-12-31
0001287213us-gaap:PatentsMember2022-12-31
0001287213us-gaap:NoncompeteAgreementsMember2022-12-31
0001287213us-gaap:TrademarksMember2022-12-31
0001287213us-gaap:TrademarksAndTradeNamesMember2021-12-31
0001287213us-gaap:DistributionRightsMember2021-12-31
0001287213us-gaap:CustomerRelationshipsMember2021-12-31
0001287213us-gaap:PatentsMember2021-12-31
0001287213us-gaap:NoncompeteAgreementsMember2021-12-31
0001287213us-gaap:TrademarksMember2021-12-31
0001287213us-gaap:SecuredDebtMember2022-12-31
0001287213us-gaap:SecuredDebtMember2021-12-31
0001287213plow:SeniorSecuredTermLoanFacilityMember2021-06-09
0001287213us-gaap:RevolvingCreditFacilityMember2021-06-09
0001287213us-gaap:LetterOfCreditMember2021-06-09
0001287213plow:SwinglineLoanMember2021-06-09
0001287213plow:CreditAgreementMembersrt:MaximumMember2021-06-09
0001287213us-gaap:RevolvingCreditFacilityMembersrt:MinimumMember2022-01-012022-12-31
0001287213us-gaap:RevolvingCreditFacilityMembersrt:MaximumMember2022-01-012022-12-31
0001287213plow:SeniorSecuredTermLoanFacilityMembersrt:MinimumMemberplow:LeverageRatioOneMemberus-gaap:LondonInterbankOfferedRateLIBORMember2022-01-012022-12-31
0001287213plow:SeniorSecuredTermLoanFacilityMembersrt:MaximumMemberplow:LeverageRatioOneMemberus-gaap:LondonInterbankOfferedRateLIBORMember2022-01-012022-12-31
0001287213us-gaap:RevolvingCreditFacilityMembersrt:MinimumMemberplow:LeverageRatioTwoMemberus-gaap:LondonInterbankOfferedRateLIBORMember2022-01-012022-12-31
0001287213us-gaap:RevolvingCreditFacilityMembersrt:MaximumMemberplow:LeverageRatioTwoMemberus-gaap:LondonInterbankOfferedRateLIBORMember2022-01-012022-12-31
0001287213us-gaap:RevolvingCreditFacilityMemberplow:NewYorkFederalReserveBankNYFRBMember2022-01-012022-12-31
0001287213us-gaap:RevolvingCreditFacilityMemberplow:OneMonthAdjustedLondonInterbankOfferedRateMember2022-01-012022-12-31
0001287213plow:CreditAgreementMember2022-12-31
0001287213plow:CreditAgreementMember2022-01-012022-12-31
0001287213us-gaap:RevolvingCreditFacilityMember2022-12-31
0001287213us-gaap:LineOfCreditMemberus-gaap:SecuredDebtMember2022-01-012022-12-31
utr:D
0001287213us-gaap:LineOfCreditMemberus-gaap:SecuredDebtMembersrt:MaximumMember2022-01-012022-12-31
0001287213us-gaap:LineOfCreditMemberus-gaap:SecuredDebtMember2020-01-312020-01-31
0001287213us-gaap:LineOfCreditMemberus-gaap:SecuredDebtMember2021-12-312021-12-31
0001287213us-gaap:LineOfCreditMemberus-gaap:SecuredDebtMember2021-03-312021-03-31
0001287213plow:InterestRateSwapEffectiveMay312019ThroughMay312024Member2019-06-13
0001287213us-gaap:InterestRateSwapMember2021-01-012021-12-31
0001287213us-gaap:InterestRateSwapMember2022-05-19
0001287213us-gaap:InterestRateSwapMember2022-05-192022-05-19
0001287213us-gaap:PrepaidExpensesAndOtherCurrentAssetsMemberus-gaap:InterestRateSwapMember2022-12-31
0001287213us-gaap:OtherNoncurrentAssetsMemberus-gaap:InterestRateSwapMember2022-12-31
0001287213plow:AccruedExpensesAndOtherCurrentLiabilitiesMemberus-gaap:InterestRateSwapMember2021-12-31
0001287213us-gaap:OtherNoncurrentLiabilitiesMemberus-gaap:InterestRateSwapMember2021-12-31
0001287213plow:BailmentPoolArrangementMemberus-gaap:PrimeRateMember2022-12-31
0001287213plow:BailmentPoolArrangementMembersrt:MinimumMemberus-gaap:PrimeRateMember2022-01-012022-12-31
0001287213plow:BailmentPoolArrangementMembersrt:MaximumMemberus-gaap:PrimeRateMember2022-01-012022-12-31
0001287213plow:BailmentPoolArrangementMember2022-01-012022-12-31
0001287213plow:BailmentPoolArrangementMember2021-01-012021-12-31
0001287213us-gaap:LineOfCreditMemberplow:FloorPlanArrangementMember2022-12-31
0001287213us-gaap:LineOfCreditMemberplow:FloorPlanArrangementMemberus-gaap:LondonInterbankOfferedRateLIBORMember2022-01-012022-12-31
0001287213us-gaap:LineOfCreditMemberplow:FloorPlanArrangementMember2021-12-31
0001287213us-gaap:LineOfCreditMemberplow:FloorPlanArrangementMember2022-01-012022-12-31
0001287213us-gaap:LineOfCreditMemberplow:FloorPlanArrangementMember2021-01-012021-12-31
0001287213plow:SnowAndIceControlEquipmentMembersrt:MinimumMember2022-01-012022-12-31
0001287213plow:SnowAndIceControlEquipmentMembersrt:MaximumMember2022-01-012022-12-31
0001287213plow:PartsAndAccessoriesMember2022-01-012022-12-31
0001287213plow:CertainSnowplowsMember2022-01-012022-12-31
0001287213us-gaap:StateAndLocalJurisdictionMember2022-12-31
0001287213us-gaap:DomesticCountryMember2022-12-31
0001287213us-gaap:DomesticCountryMember2022-01-012022-12-31
0001287213us-gaap:StateAndLocalJurisdictionMember2022-01-012022-12-31
0001287213us-gaap:OtherPostretirementBenefitPlansDefinedBenefitMember2022-12-31
0001287213us-gaap:OtherPostretirementBenefitPlansDefinedBenefitMember2021-12-31
0001287213us-gaap:OtherPostretirementBenefitPlansDefinedBenefitMember2022-01-012022-12-31
0001287213us-gaap:OtherPostretirementBenefitPlansDefinedBenefitMember2020-12-31
0001287213us-gaap:OtherPostretirementBenefitPlansDefinedBenefitMember2021-01-012021-12-31
0001287213us-gaap:OtherPostretirementBenefitPlansDefinedBenefitMember2020-01-012020-12-31
0001287213plow:SupplementalNonQualifiedPlanMember2022-01-012022-12-31
0001287213plow:SupplementalNonQualifiedPlanMember2021-01-012021-12-31
0001287213plow:SupplementalNonQualifiedPlanMember2020-01-012020-12-31
0001287213plow:SupplementalNonQualifiedPlanMember2022-12-31
0001287213plow:SupplementalNonQualifiedPlanMember2021-12-31
0001287213plow:SupplementalNonQualifiedPlanMember2020-12-31
0001287213plow:The2010StockIncentivePlanMember2010-05-31
0001287213plow:The2010StockIncentivePlanMemberus-gaap:CommonStockMember2022-12-31
0001287213us-gaap:RestrictedStockUnitsRSUMemberplow:The2010StockIncentivePlanMember2022-01-012022-12-31
0001287213us-gaap:RestrictedStockUnitsRSUMember2022-01-012022-12-31
0001287213us-gaap:RestrictedStockUnitsRSUMember2021-01-012021-12-31
0001287213us-gaap:RestrictedStockUnitsRSUMember2020-01-012020-12-31
0001287213us-gaap:RestrictedStockUnitsRSUMember2019-12-31
0001287213us-gaap:RestrictedStockUnitsRSUMember2019-01-012019-12-31
0001287213us-gaap:RestrictedStockUnitsRSUMember2020-12-31
0001287213us-gaap:RestrictedStockUnitsRSUMember2021-12-31
0001287213us-gaap:RestrictedStockUnitsRSUMember2022-12-31
0001287213us-gaap:RestrictedStockUnitsRSUMemberplow:The2010StockIncentivePlanMember2021-01-012021-12-31
0001287213us-gaap:RestrictedStockUnitsRSUMemberplow:The2010StockIncentivePlanMember2020-01-012020-12-31
0001287213us-gaap:RestrictedStockUnitsRSUMemberplow:The2010StockIncentivePlanMember2022-12-31
0001287213us-gaap:PerformanceSharesMemberplow:The2010StockIncentivePlanMember2022-01-012022-12-31
0001287213us-gaap:PerformanceSharesMemberplow:The2010StockIncentivePlanMember2021-01-012021-12-31
0001287213us-gaap:PerformanceSharesMemberplow:The2010StockIncentivePlanMember2020-01-012020-12-31
0001287213us-gaap:PerformanceSharesMemberplow:The2010StockIncentivePlanMember2022-01-012022-03-31
0001287213us-gaap:PerformanceSharesMember2022-01-012022-12-31
0001287213us-gaap:PerformanceSharesMember2021-01-012021-12-31
0001287213us-gaap:PerformanceSharesMember2020-01-012020-12-31
0001287213us-gaap:PerformanceSharesMember2022-12-31
0001287213us-gaap:RestrictedStockUnitsRSUMember2020-01-012020-12-31
0001287213plow:HendersonIncMember2020-01-012020-12-31
0001287213plow:DejanaMember2020-01-012020-12-31
0001287213us-gaap:SeriesAPreferredStockMember2022-12-31
0001287213us-gaap:AllowanceForCreditLossMember2021-12-31
0001287213us-gaap:AllowanceForCreditLossMember2022-01-012022-12-31
0001287213us-gaap:AllowanceForCreditLossMember2022-12-31
0001287213us-gaap:ValuationAllowanceOfDeferredTaxAssetsMember2021-12-31
0001287213us-gaap:ValuationAllowanceOfDeferredTaxAssetsMember2022-01-012022-12-31
0001287213us-gaap:ValuationAllowanceOfDeferredTaxAssetsMember2022-12-31
0001287213us-gaap:AllowanceForCreditLossMember2020-12-31
0001287213us-gaap:AllowanceForCreditLossMember2021-01-012021-12-31
0001287213us-gaap:ValuationAllowanceOfDeferredTaxAssetsMember2020-12-31
0001287213us-gaap:ValuationAllowanceOfDeferredTaxAssetsMember2021-01-012021-12-31
0001287213us-gaap:AllowanceForCreditLossMember2019-12-31
0001287213us-gaap:AllowanceForCreditLossMember2020-01-012020-12-31
0001287213us-gaap:ValuationAllowanceOfDeferredTaxAssetsMember2019-12-31
0001287213us-gaap:ValuationAllowanceOfDeferredTaxAssetsMember2020-01-012020-12-31
0001287213us-gaap:AccumulatedGainLossNetCashFlowHedgeParentMember2021-12-31
0001287213us-gaap:AccumulatedDefinedBenefitPlansAdjustmentMember2021-12-31
0001287213us-gaap:AccumulatedGainLossNetCashFlowHedgeParentMember2022-01-012022-12-31
0001287213us-gaap:AccumulatedDefinedBenefitPlansAdjustmentMember2022-01-012022-12-31
0001287213us-gaap:AccumulatedGainLossNetCashFlowHedgeParentMember2022-12-31
0001287213us-gaap:AccumulatedDefinedBenefitPlansAdjustmentMember2022-12-31
0001287213us-gaap:AccumulatedGainLossNetCashFlowHedgeParentMember2020-12-31
0001287213us-gaap:AccumulatedDefinedBenefitPlansAdjustmentMember2020-12-31
0001287213us-gaap:AccumulatedGainLossNetCashFlowHedgeParentMember2021-01-012021-12-31
0001287213us-gaap:AccumulatedDefinedBenefitPlansAdjustmentMember2021-01-012021-12-31
00012872132022-01-012022-03-31
00012872132022-04-012022-06-30
00012872132022-07-012022-09-30
00012872132022-10-012022-12-31
00012872132021-01-012021-03-31
00012872132021-04-012021-06-30
00012872132021-07-012021-09-30
00012872132021-10-012021-12-31
0001287213plow:SeniorSecuredTermLoanFacilityMember2021-06-19
0001287213us-gaap:RevolvingCreditFacilityMember2021-06-19
0001287213us-gaap:LetterOfCreditMember2021-06-19
0001287213plow:SwinglineLoanMember2021-06-19
0001287213plow:CreditAgreementMembersrt:MaximumMember2021-06-19
0001287213us-gaap:RevolvingCreditFacilityMemberus-gaap:SubsequentEventMember2023-01-05
0001287213plow:SeniorSecuredTermLoanFacilityMembersrt:MinimumMemberplow:LeverageRatioOneMemberus-gaap:SubsequentEventMemberus-gaap:SecuredOvernightFinancingRateSofrOvernightIndexSwapRateMember2023-01-052023-01-05
0001287213plow:SeniorSecuredTermLoanFacilityMembersrt:MaximumMemberplow:LeverageRatioOneMemberus-gaap:SubsequentEventMemberus-gaap:SecuredOvernightFinancingRateSofrOvernightIndexSwapRateMember2023-01-052023-01-05
0001287213us-gaap:RevolvingCreditFacilityMemberus-gaap:SubsequentEventMemberus-gaap:SecuredOvernightFinancingRateSofrOvernightIndexSwapRateMember2023-01-052023-01-05
0001287213us-gaap:RevolvingCreditFacilityMembersrt:MinimumMemberplow:LeverageRatioOneMemberus-gaap:SubsequentEventMemberus-gaap:SecuredOvernightFinancingRateSofrOvernightIndexSwapRateMember2023-01-052023-01-05
0001287213us-gaap:RevolvingCreditFacilityMembersrt:MaximumMemberplow:LeverageRatioOneMemberus-gaap:SubsequentEventMemberus-gaap:SecuredOvernightFinancingRateSofrOvernightIndexSwapRateMember2023-01-052023-01-05
0001287213us-gaap:RevolvingCreditFacilityMembersrt:MinimumMemberplow:LeverageRatioTwoMemberus-gaap:SubsequentEventMemberus-gaap:SecuredOvernightFinancingRateSofrOvernightIndexSwapRateMember2023-01-052023-01-05
0001287213us-gaap:RevolvingCreditFacilityMembersrt:MaximumMemberplow:LeverageRatioTwoMemberus-gaap:SubsequentEventMemberus-gaap:SecuredOvernightFinancingRateSofrOvernightIndexSwapRateMember2023-01-052023-01-05
0001287213us-gaap:RevolvingCreditFacilityMemberus-gaap:SubsequentEventMemberplow:NewYorkFederalReserveBankNYFRBMember2023-01-052023-01-05
0001287213us-gaap:RevolvingCreditFacilityMemberus-gaap:SubsequentEventMemberplow:OneMonthAdjustedTermSofrRateMember2023-01-052023-01-05
Table of Contents
UNITED STATES
SECURITIES AND EXCHANGE COMMISSION
Washington, D.C. 20549
FORM 10-K
| (Mark One) | |
| ☒ | Annual Report Pursuant to Section 13 or 15(d) of the Securities Exchange Act of 1934 |
| |
| For the fiscal year ended December 31, 2022 |
| |
| or |
| | |
| ☐ | Transition Report Pursuant to Section 13 or 15(d) of the Securities Exchange Act of 1934 |
| |
| For the transition period from to |
Commission File No. 001-34728
DOUGLAS DYNAMICS, INC.
(Exact name of registrant as specified in its charter)
| Delaware
(State or other jurisdiction of
incorporation or organization) | 13-4275891
(I.R.S. Employer
Identification No.) |
| 11270 W Park Place Ste. 300
Milwaukee, Wisconsin
(Address of principal executive offices) | 53224
(Zip Code) |
Registrant’s telephone number, including area code (414) 354‑2310
Securities registered pursuant to Section 12(b) of the Act:
| Title of each class | Trading Symbol(s) | Name of each exchange on which registered |
| Common Stock, par value $.01 per share | PLOW | New York Stock Exchange |
Securities registered pursuant to Section 12(g) of the Act: NONE
Indicate by check mark if the registrant is a well‑known seasoned issuer, as defined in Rule 405 of the Securities Act. Yes ☒ No ☐.
Indicate by check mark if the registrant is not required to file reports pursuant to Section 13 or Section 15(d) of the Act. Yes ☐ No ☒.
Indicate by check mark whether the registrant (1) has filed all reports required to be filed by Section 13 or 15(d) of the Securities Exchange Act of 1934 during the preceding 12 months (or for such shorter period that the registrant was required to file such reports), and (2) has been subject to such filing requirements for the past 90 days. Yes ☒ No ☐.
Indicate by check mark whether the registrant has submitted electronically every Interactive Data File required to be submitted pursuant to Rule 405 of Regulation S‑T (232.405 of this chapter) during the preceding 12 months (or for such shorter period that the registrant was required to submit such files). Yes ☒ No ☐.
Indicate by check mark whether the registrant is a large accelerated filer, an accelerated filer, a non‑accelerated filer, smaller reporting company, or an emerging growth company. See definitions of “large accelerated filer,” “accelerated filer,” “smaller reporting company,” and “emerging growth company” in Rule 12b‑2 of the Exchange Act.
| Large accelerated filer ☒ | Accelerated filer ☐ | Non‑accelerated filer ☐ | Smaller reporting company ☐ Emerging growth company ☐ |
If an emerging growth company, indicate by check mark if the registrant has elected not to use the extended transition period for complying with any new or revised financial accounting standards provided pursuant to Section 13(a) of the Exchange Act. ☐
Indicate by check mark whether the registrant has filed a report on and attestation to its management’s assessment of the effectiveness of its internal control over financial reporting under Section 404(b) of the Sarbanes-Oxley Act (15 U.S.C. 7262(b)) by the registered public accounting firm that prepared or issued its audit report. ☒
If securities are registered pursuant to Section 12(b) of the Act, indicate by check mark whether the financial statements of the registrant included in the filing reflect the correction of an error to previously issued financial statements. ☐
Indicate by check mark whether any of those error corrections are restatements that required a recovery analysis of incentive-based compensation received by any of the registrant's executive officers during the relevant recovery period pursuant to §240.10D-1(b). ☐
Indicate by check mark whether the registrant is a shell company (as defined in Rule 12b‑2 of the Exchange Act). Yes ☐ No ☒.
At June 30, 2022, the last business day of the registrant’s most recently completed second fiscal quarter, the aggregate market value of the voting stock of the Registrant held by stockholders who were not affiliates of the Registrant was approximately $658 million (based upon the closing price of Registrant’s Common Stock on the New York Stock Exchange on such date). At February 21, 2023, the Registrant had outstanding an aggregate of 22,886,793 shares of its Common Stock.
Documents Incorporated by Reference:
Portions of the Proxy Statement for the Registrant’s Annual Meeting of Shareholders to be held on April 25, 2023, which Proxy Statement will be filed with the Securities and Exchange Commission no later than 120 days after the close of the fiscal year ended December 31, 2022, are incorporated into Part III.
PART I
Forward Looking Statements
This Annual Report on Form 10‑K contains “forward‑looking statements” made within the meaning of the Private Securities Litigation Reform Act of 1995. Words such as “anticipate,” “believe,” “intend,” “estimate,” “expect,” “continue,” “should,” “could,” “may,” “plan,” “project,” “predict,” “will” and similar expressions are intended to identify forward ‑ looking statements. In addition, statements covering our future sales or financial performance and our plans, performance and other objectives, expectations or intentions are forward‑looking statements, such as statements regarding our liquidity, debt, planned capital expenditures, and adequacy of capital resources and reserves. Factors that could cause our actual results to differ materially from those expressed or implied in such forward‑looking statements include, but are not limited to:
| |
● |
Weather conditions, particularly lack of or reduced levels of snowfall and the timing of such snowfall, including as a result of global climate change; |
| |
● |
Our inability to maintain good relationships with the original equipment manufacturers (“OEM”) with whom we currently do significant business; |
| |
● |
The inability of our suppliers and OEM partners to meet our volume or quality requirements; |
| |
● |
Increases in the price of steel or other materials, including as a result of tariffs, necessary for the production of our products that cannot be passed on to our distributors; |
| |
● |
Increases in the price of fuel or freight; |
| |
● |
The effects of laws and regulations and their interpretations on our business and financial conditions, including policy or regulatory changes related to climate change; |
| |
● |
A significant decline in economic conditions, including as a result of the COVID-19 pandemic; |
| |
● |
Our inability to maintain good relationships with our distributors; |
| |
● |
Lack of available or favorable financing options for our end‑users, distributors or customers; |
| |
● |
Inaccuracies in our estimates of future demand for our products; |
| |
● |
Our inability to protect or continue to build our intellectual property portfolio; |
| |
● |
Our inability to develop new products or improve upon existing products in response to end‑user needs; |
| |
● |
Losses due to lawsuits arising out of personal injuries associated with our products; |
| |
● |
Factors that could impact the future declaration and payment of dividends or our ability to execute repurchases under our stock repurchase program; |
| |
● |
Our inability to compete effectively against our competition; and |
| |
● |
Our inability to achieve the projected financial performance with the business of Henderson Enterprises Group, Inc. (“Henderson”), which we acquired in 2014, or with the assets of Dejana Truck & Utility Equipment Company, Inc. (“Dejana”), which we acquired in 2016 and unexpected costs or liabilities related to such acquisitions. |
We undertake no obligation to revise the forward‑looking statements included in this Annual Report on Form 10‑K to reflect any future events or circumstances. Our actual results, performance or achievements could differ materially from the results expressed in, or implied by, these forward‑looking statements. Factors in addition to those listed above that could cause or contribute to such differences are discussed in Item 1A, “Risk Factors” of the Annual Report on Form 10‑K.
Item 1. Business
Overview
Home to the best-selling brands in the industry, Douglas Dynamics, Inc. (the “Company,” “we,” “us,” “our”) is North America's premier manufacturer and upfitter of commercial work truck attachments and equipment. For more than 75 years, the Company has been innovating products that enable end-users to perform their jobs more efficiently and effectively, providing opportunities for businesses to increase profitability. Our commitment to continuous improvement enables us to consistently produce high quality products and drive shareholder value. The Douglas Dynamics portfolio of products and services is separated into two segments: First, the Work Truck Attachments segment, which includes our operations that manufacture and sell snow and ice control attachments and other products sold under the FISHER®, SNOWEX® and WESTERN® brands, as well as our vertically integrated products. Second, the Work Truck Solutions segment, which includes manufactured municipal snow and ice control products under the HENDERSON® brand and the upfit of market leading attachments and storage solutions under the HENDERSON® brand, and the DEJANA® brand and its related sub-brands. For additional financial information regarding our reportable business segments, see Note 17 of the Notes to Consolidated Financial Statements of this report.
In our Work Truck Attachments segment, we offer a broad product line of snowplows and sand and salt spreaders for light trucks that we believe to be the most complete line offered in the U.S. and Canadian markets. We also provide a full range of related parts and accessories, which generates an ancillary revenue stream throughout the lifecycle of our snow and ice control equipment. For the years ended December 31, 2022, 2021 and 2020, 85%, 84% and 86% of our net sales in our Work Truck Attachments segment were generated from sales of snow and ice control equipment, respectively, and 15%, 16% and 14% of our net sales in our Work Truck Attachments segment were generated from sales of parts and accessories, respectively. While we measure sales of parts and accessories separately from snow and ice control equipment, they are integrated with one another and are not separable.
We sell our Work Truck Attachments products through a distributor network primarily to professional snowplowers who are contracted to remove snow and ice from commercial and residential areas. We have engendered exceptional customer loyalty for our products because of our ability to satisfy the stringent demands of our customers for a high degree of quality, reliability and service. As a result, we believe our installed base is the largest in the light truck market with over 500,000 snowplows and sand and salt spreaders in service. Because sales of snowplows and sand and salt spreaders are primarily driven by the need of our core end‑user base to replace worn existing equipment, we believe our substantial installed base provides us with a high degree of predictable sales over any extended period of time.
We believe that our Work Truck Attachments segment has the snow and ice control industry’s most extensive distribution network worldwide, which consists of approximately 3,100 points of sale. Direct points of shipment are predominantly through North American truck equipment and lawn care equipment distributors. Most of our distributors are located throughout the snow belt regions in North America (primarily the Midwest, East and Northeast regions of the United States as well as all provinces of Canada). We have longstanding relationships with many of our distributors. We continually seek to grow and optimize our network by opportunistically adding high‑quality, well‑capitalized distributors in select geographic areas and by cross‑selling our industry leading brands within our distribution network. We have extended our reach to international markets, establishing distribution relationships in Northern Europe and Asia, where we believe meaningful growth opportunities exist.
Our Work Truck Solutions segment participates in the manufacture of municipal snow and ice control products and offers a complementary line of upfitting services and products. Our Work Truck Solutions products consist of truck and vehicle upfits where we attach component pieces of equipment, truck bodies, racking, and storage solutions with varying levels of complexity to a vehicle chassis, and which are typically used by end-users for work related purposes. Our Work Truck Solutions segment is a premier upfitter of Class 3 - 8 trucks and other commercial work vehicles. We also provide customized turnkey solutions to governmental agencies such as Departments of Transportation (“DOTs”) and municipalities. Additionally, we believe that our Work Truck Solutions segment is a leading specialized manufacturer of storage solutions for trucks and vans and cable pulling equipment for trucks. We believe we are a regional market leader in the truck and vehicle upfitting market. We believe that our Work Truck Solutions business possesses significant customer relationships comprised of approximately 2,800 customers across the truck equipment industry. We have longstanding relationships with many of our Work Truck Solutions customers. We continually seek to grow and strengthen our customer relationships by providing custom solutions to our customers’ evolving specialty upfit needs. We are able to serve our Work Truck Solutions customers’ needs through our bailment and floor plan agreements with original equipment vehicle manufacturers who supply truck chassis, on which we perform custom upfits for our customers.
We believe we are a leader in operational efficiency in our industries, resulting from our application of lean manufacturing principles, our vertical integration, and a highly variable cost structure We continually seek to use lean principles to reduce costs and increase the efficiency of our manufacturing operations. During the year ended December 31, 2022 we manufactured our products and upfitted vehicles in five facilities that we own in Milwaukee, Wisconsin; Rockland, Maine; Madison Heights, Michigan; Manchester, Iowa; and Huntley, Illinois. We also lease fifteen manufacturing, service and upfit facilities, located in Iowa, Maryland, Missouri, New Jersey, New York, Ohio, Pennsylvania, and Rhode Island. Furthermore, our manufacturing efficiency allows us to deliver desired products quickly to our customers, especially during times of sudden and unpredictable snowfall events when our customers need our products immediately.
Our Industry
Work Truck Attachments Segment
Our Work Truck Attachments Segment participates primarily in the snow and ice control equipment industries in North America. These industries consist predominantly of domestic participants that manufacture their products in North America. The annual demand for snow and ice control equipment is driven primarily by the replacement cycle of the existing installed base, which is predominantly a function of the average life of a snowplow or spreader and is driven by usage and maintenance practices of the end‑user. We believe actively‑used snowplows are typically replaced, on average, every 9 to 12 years.
We believe that sales of both light and heavy duty snow and ice control equipment are driven primarily by the replacement cycle of the existing installed base, which is predominantly a function of the average life of a snowplow or spreader and is driven by usage and maintenance practices of the end‑user. The primary factor influencing the replacement cycle for snow and ice control equipment for light trucks is the level, timing and location of snowfall. Sales of snow and ice control equipment in any given year and region are most heavily influenced by local snowfall levels in the prior snow season. Heavy snowfall during a given winter causes equipment usage to increase, resulting in greater wear and tear and shortened life cycles, thereby creating a need for replacement equipment and additional parts and accessories.
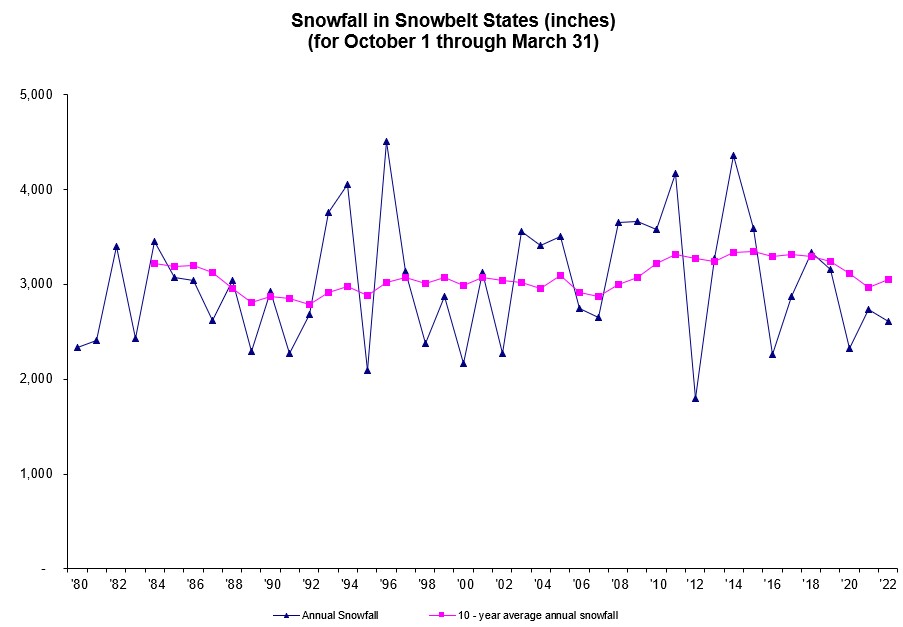
While snowfall levels vary within a given year and from year‑to‑year, snowfall, and the corresponding replacement cycle of snow and ice control equipment, is relatively consistent over multi‑year periods. The following chart depicts aggregate annual and ten‑year (based on the typical life of our snowplows) rolling average of the aggregate snowfall levels in 66 cities in 26 snow belt states across the Northeast, East, Midwest and Western United States where we monitor snowfall levels from 1980 to 2022. As the chart indicates, since 1984, aggregate snowfall levels in any given rolling ten‑year period have been fairly consistent, ranging from 2,782 to 3,345 inches.
| Note: |
The 10‑year rolling average snowfall is not presented prior to 1984 for purposes of the calculation due to lack of snowfall data prior to 1975. Snowfall data in this chart is not adjusted for snowfall outside of the 66 cities in the 26 states reflected. |
| |
|
| Source: |
National Oceanic and Atmospheric Administration’s National Weather Service. |
The demand for snow and ice control equipment can also be influenced by general economic conditions in the United States, as well as local economic conditions in the snow‑belt regions in North America. In stronger economic conditions, our end‑users may choose to replace or upgrade existing equipment before its useful life has ended, while in weak economic conditions, our end‑users may seek to extend the useful life of equipment, thereby increasing the sales of parts and accessories. However, since snow and ice control management is a non‑discretionary service necessary to ensure public safety and continued personal and commercial mobility in populated areas that receive snowfall, end‑users cannot extend the useful life of snow and ice control equipment indefinitely and must replace equipment that has become too worn, unsafe or unreliable, regardless of economic conditions. While our parts and accessories yield slightly higher gross margins than our snow and ice control equipment, they yield significantly lower revenue than equipment sales, which adversely affects our results of operations. See “Management’s Discussion and Analysis of Financial Condition and Results of Operations—Seasonality and Year‑to‑Year Variability.”
Long‑term growth in the overall snow and ice control equipment market also results from geographic expansion of developed areas in the snow belt regions of North America (primarily the Midwest, East and Northeast regions of the United States as well as all provinces of Canada), as well as consumer demand for technological enhancements in snow and ice control equipment and related parts and accessories that improves efficiency and reliability. Continued construction in the snow belt regions in North America increases the aggregate area requiring snow and ice removal, thereby growing the market for snow and ice control equipment. Additionally, there is continued potential for growth within Work Truck Attachments related to the sale of non-truck snow and ice control equipment, including utility terrain vehicle (“UTV”) plows and other such equipment. Additionally, in order to ensure reliable commerce and safe roads, distribution of our ice control equipment continues to expand into states south of the snow belt. The development and sale of more reliable, more efficient and more sophisticated products have contributed to an approximate 2% to 4% average unit price increase in each of 2017 through 2020. In 2021 and 2022, more significant price increases were implemented across both Work Truck Attachments and Work Truck Solutions in response to materials, freight and labor inflation. There were multiple price increases ranging from the mid-single digits to low double-digits and were implemented at various points in 2021 and 2022.
Work Truck Solutions Segment
Our Work Truck Solutions Segment primarily participates in the manufacture of municipal snow and ice control products, as well as in the truck and vehicle upfitting industry in the United States. This industry consists predominantly of domestic participants that upfit work trucks and vehicles. Specifically, there are regional market leaders that operate in close proximity to the original equipment vehicle manufacturers’ facilities and vehicle ports of entry. In addition to the regional market leaders, there exist smaller upfit businesses. Our Work Truck Solutions segment competes against both the other regional market leaders and the smaller market participants. The annual demand for upfit vehicles is subject to the general macro-economic environment trends and municipal budgets.
We believe our Work Truck Solutions segment is a regional market leader in the Northeast and Mid-Atlantic regions of the United States. We serve a variety of different customers that include dealers who typically sell to light and heavy duty truck end-users and to large national customers who purchase fleets of upfitted vehicles. Heavy duty truck end-users typically are comprised of local governments and municipalities which plan for and execute planned replacement of equipment over time. Approximately half of our revenues are derived from dealer customers, while approximately 40% of our revenues are fleet sales and sales to governmental entities. Our remaining sales are derived from over the counter sales of parts and accessories.
Long term growth in the truck and vehicle upfit market will depend on technological advances in the component products and advances in the original equipment manufacturer’s vehicles, as well customer demand for such products. Along with technological advancements, end-users are demanding more specialized vehicles specifically related to their unique work related needs, which we expect will further increase demand. Along with technological advancements, products become more complex in the marketplace, thus increasing the importance of the role of the truck upfitter in the value chain.
Our Competitive Strengths
We compete solely with other North American manufacturers and upfitters who do not benefit from our manufacturing efficiencies, depth and breadth of products, extensive distributor network and customer relationships. As the market leader in the industries we serve, we enjoy a set of competitive advantages versus smaller competitors, which allows us to generate robust cash flows in all market environments and to support continued investment in our products, distribution capabilities and brand regardless of annual volume fluctuations. We believe these advantages are rooted in the following competitive strengths and reinforce our industry leadership over time.
Exceptional Customer Loyalty and Brand Equity. Our brands enjoy exceptional customer loyalty and brand equity in the snow and ice control equipment and truck upfitting industries with both end‑users and distributors, which have been developed through over 75 years of superior innovation, productivity, reliability and support, consistently delivered year after year. We believe past brand experience, rather than price, is the key factor impacting our products.
Broadest and Most Innovative Product Offering in Work Truck Attachments. In our Work Truck Attachments segment, we provide the industry’s broadest product offering with a full range of snowplows, sand and salt spreaders and related parts and accessories. We believe we maintain the industry’s largest and most advanced in‑house new product development program, historically introducing several new and redesigned products each year. Our broad product offering and commitment to new product development is essential to maintaining and growing our leading market share position as well as continuing to increase the profitability of our business. Meanwhile at our Work Truck Solutions segment, each upfit is customized to the specific needs of our customers.
Extensive North American Distributor Network in Work Truck Attachments. With approximately 3,100 points of sale at our Work Truck Attachments segment, we benefit from having what we believe to be the most extensive distributor network in the light truck and heavy duty snow and ice control equipment industry, providing a significant competitive advantage over our peers. Our distributors function not only as sales and support agents (providing access to parts and service), but also as industry partners providing real‑time end‑user information, such as retail inventory levels, changing consumer preferences or desired functionality enhancements, which we use as the basis for our product development efforts.
Leader in Operational Efficiency. We believe we are a leader in operational efficiency in our industries, resulting from our application of lean manufacturing principles and a highly variable cost structure. By utilizing lean principles, we are able to adjust production levels easily to meet fluctuating demand, while controlling costs in slower periods. This operational efficiency is supplemented by our highly variable cost structure, driven in part by our access to a sizable temporary workforce (comprising approximately 10‑15% of our Work Truck Attachments workforce during average snowfall years), which we can quickly adjust, as needed. These manufacturing efficiencies enable us to respond rapidly to urgent customer demand during times of sudden and unpredictable snowfalls, allowing us to provide exceptional service to our existing customer base and capture new customers from competitors that we believe cannot service their customers’ needs with the same speed and reliability.
Strong Cash Flow Generation. We are able to generate significant cash flow as a result of relatively consistent high profitability, low capital spending requirements and predictable timing of our working capital requirements. Our significant cash flow has allowed us to reinvest in our business, pay down long term debt, pay substantial dividends to our stockholders, and make strategic acquisitions.
Experienced Management Team. We believe our business benefits from an exceptional management team that is responsible for establishing our leadership in the light truck and heavy duty snow and ice control equipment and truck upfitting industries. Our senior management team, consisting of four officers as of December 31, 2022, has an average of approximately sixteen years of weather‑related industry experience and an average of over sixteen years with our company. On January 1, 2019, Robert McCormick became our President and Chief Executive Officer. He has been with us for over 18 years and has served in various roles, including Chief Operating Officer and Chief Financial Officer, among others. Effective December 31, 2022, Keith Hagelin, President, Work Truck Attachments, retired from the Company. Through management’s strategic vision, we have been able to expand our distributor network and grow our market leading position.
Our Business Strategy
Our business strategy is to capitalize on our competitive strengths to maximize cash flow to reinvest in our business, pay dividends, reduce indebtedness, execute repurchases under our stock repurchase program and to create stockholder value. We have also developed a management system called the Douglas Dynamics Management System (“DDMS”) that is intended to assist in value creation and enhanced customer service and includes a collection of tools to solve problems and deliver greater value to our customers by eliminating waste and improving the way we work. DDMS is an integrated system that continues to evolve with our business to deliver on strategic priorities and goals through a culture of continuous improvement, people who embrace change, world-class processes, and practical tools. The building blocks of our strategy are:
Continuous Product Innovation. We believe new product innovation is critical to maintaining and growing our market leading position in the snow and ice control equipment industry. We will continue to focus on developing innovative solutions to increase productivity, ease of use, reliability, durability and serviceability of our products and on incorporating lean manufacturing concepts into our product development process, which has allowed us to reduce the overall cost of development and, more importantly, to reduce our time‑to‑market.
Distributor Network and Customer Optimization. At our Work Truck Attachment segment, we will continually seek opportunities to continue to expand our extensive distribution network by adding high‑quality, well‑capitalized distributors in select geographic areas and by cross‑selling our industry leading brands within our distribution network to ensure we maximize our ability to generate revenue while protecting our industry leading reputation, customer loyalty and brands. We will also focus on optimizing this network by providing in‑depth training, valuable distributor support and attractive promotional and incentive opportunities. As a result of these efforts, we believe a majority of our distributors choose to sell our products exclusively. We believe this sizable high quality network is unique in the industry, providing us with valuable insight into purchasing trends and customer preferences, and would be very difficult to replicate. At our Work Truck Solutions segment, we have well developed customer relationships resulting from being responsive to the needs of our customers. We will seek opportunities to continue to expand our customer group by increasing throughput, allowing us to grow our customer base and continue to be responsive to our customers’ specialized upfit needs.
Aggressive Asset Management and Profit Focus. We will continue to aggressively manage our assets in order to maximize our cash flow generation despite seasonal and annual variability in snowfall levels that affect our Work Truck Attachments segment. We believe our ability is unique in our industry and enables us to achieve attractive margins in all snowfall environments. Key elements of our asset management and profit focus strategies include:
| |
● |
employment of a highly variable cost structure, which can allow us to quickly adjust costs in response to real‑time changes in demand; |
| |
● |
use of enterprise‑wide lean principles, which allow us to easily adjust production levels up or down to meet demand; |
| |
● |
implementation of a pre‑season order program, which incentivizes distributors to place orders prior to the retail selling season and thereby enables us to more efficiently utilize our assets; and |
| |
● |
development of a vertically integrated business model, which we believe provides us cost advantages over our competition. |
Additionally, although modest, our capital expenditure requirements and operating expenses can be temporarily reduced in response to anticipated or actual lower sales in a particular year to maximize cash flow.
Flexible, Lean Enterprise Platform. We will continue to utilize lean principles to maximize the flexibility, efficiency and productivity of our manufacturing operations while reducing the associated costs, enabling us to increase distributor and end‑user satisfaction. For example, in an environment where shorter lead times and near‑perfect order fulfillment are important to our distributors, we believe our lean processes have helped us to improve our shipping performance and build a reputation for providing industry leading shipping performance.
Our Growth Opportunities
Opportunistically Seek New Products and New Markets. We plan to continue to evaluate other acquisition opportunities within our industry that can help us expand our distribution reach, enhance our technology and as a consequence improve the breadth and depth of our product lines. We also consider diversification and vertical integration opportunities in adjacent markets that complement our business model and could offer us the ability to leverage our core competencies to create stockholder value.
Increase Our Industry Leading Market Share. In our Work Truck Attachments segment, we plan to leverage our industry leading position, distribution network and new product innovation capabilities to capture market share in the North American snow and ice control equipment market, focusing our primary efforts on increasing penetration in those North American markets where we believe our overall market share is less than 50%, including the heavy duty truck market. At our Work Truck Solutions segment, we plan to leverage our regional market leading position and utilize DDMS to further penetrate upfit markets and to grow our customer base.
Order Backlog
We had total backlog of $368.7 million and $315.4 million at December 31, 2022 and 2021, respectively. Backlog information may not be indicative of results of operations for future periods.
Human Capital Management
Our Purpose
Douglas Dynamics is home to the most trusted brands in the industry, Douglas Dynamics is North America’s premier manufacturer and upfitter of work truck attachments and equipment. Our commitment to continuous improvement enables us to consistently produce the highest quality products and drive shareholder value. We serve as trusted partners to our dealers, suppliers and end users, whose businesses benefit from our operational and management expertise.
Our Culture
For more than 75 years, Douglas Dynamics has been manufacturing the best products available on the market. Every day, our employees work hard to meet our customers’ needs, and every day we, as an organization, are focused on fostering a collaborative environment for our employees and offering them the opportunity to have ownership in our company's success. As of December 31, 2022, we employed 1,813 employees, all US based except for 14 employees who work in the Douglas Dynamics Sourcing Office located in Beijing, China. None of our employees are represented by a union and we are not party to any collective bargaining agreements. We believe that our focus on integrity, teamwork and high-performance have enabled us to create an ideal work environment for every one of our employees. Our Board of Directors and our Compensation Committee regularly receive updates from our senior management with respect to our health and safety, diversity and inclusion and our internal talent development initiatives and priorities.
Our commitment to continuous improvement extends well beyond producing the highest quality products or driving shareholder value—we also value the growth, improvement and engagement of our employees.
Creating a culture of excellence is the key to our success, which is why we work hard to give our employees the tools and training to achieve more. We know that when our employees are taken care of, our business partners get the most out of their Douglas Dynamics experience, helping us to remain North America‘s premier manufacturer of vehicle attachments and equipment.
Our Core Values and Winning Behaviors
Our Core Values, Grow, Improve, and Engage, are critical to our individual and organizational success and focus us as an organization to ensure we succeed by executing upon the right things.
Also critical to our success are our Winning Behaviors, a framework of priorities that we expect of each Douglas Dynamics employee to support the success of our company, namely, winning as an organization the right way. Our focus on our Winning Behaviors helps ensure a consistent focus on our Core Values across all employees and in all locations.
| |
● |
Be Customer and Results Driven: Consider the customer in everything you do. Focus on meaningful results that benefit both our customers and organization. |
| |
● |
Anticipate the Possibilities: See around corners. Envision and embrace new or unique ideas and seek to understand their impact on the future of our business. |
| |
● |
Collaborate and Care: Appreciate the value in working together. Work as a team to care for our customers, our business, our communities and most importantly, each other. |
| |
● |
Communicate Responsibly: Communicate to build culture and trust. Place an emphasis on listening and speaking in ways that help everyone succeed. |
| |
● |
Develop Self and Others: Take active ownership of your development and support others. Continually improve your knowledge, skills and abilities. |
| |
● |
Get Better Every Day: Make even the smallest improvement every day. Continuous improvement is at the center of everything we do. Not just what we do, but how we do it, every single day. |
Talent Development
Talent development is a critical component of individual and organizational success. We promote our internal Douglas Dynamics University (DDU) to support all employees' development. DDU is one of the services provided by the Organizational Development Team that supports our company's dedication to the performance, development, and growth of our talented people. To truly develop people, we believe in taking a balanced approach to activity selection within the offerings provided by DDU:
| Instruction |
Interaction |
Application |
| In-Person & Virtual Classes |
Coaching |
Job Rotations |
| Self-Paced eLearning |
Mentoring |
Temporary Assignments |
| Conferences |
Job Shadowing |
Projects |
| Podcasts & Webcasts |
Discussions |
Challenging Projects |
| Books & Articles |
Interest Groups |
Role Playing |
| Websites |
Book Clubs |
Doing |
| Videos |
Online Communities |
|
We achieve the goals of DDU by:
| |
● |
Developing and delivering live and virtual instructor-led training, and eLearning |
| |
● |
Managing the Douglas Dynamics Learning Center (DDLC) – an eLearning platform |
| |
● |
Supporting projects that require training creation throughout DD |
| |
● |
Developing and delivering team building activities upon request |
| |
● |
Providing training solutions that can be delivered by other teams or certified trainers |
Our Ethics
Along with our core values and winning behaviors, we act in accordance with our Code of Conduct Policy (Code of Conduct), which creates expectations and provides guidance for all our employees to make the right decisions. Our Code of Conduct covers such topics as anti-corruption, discrimination, harassment, privacy, appropriate use of company assets, protecting confidential information and reporting Code of Conduct violations.
Diversity & Inclusion
Douglas Dynamics is deeply committed to increasing diversity and inclusion; however, we continue to have more work to do across our footprint. We are investing in multiple initiatives focused on identifying diverse talent. These include engaging with recruiting firms, utilizing job-posting sites and collaborating with university programs that specialize in connecting companies like Douglas Dynamics with a diverse array of candidates. Moving forward, we will continue to review and refine our initiatives as we seek to further diversify our workforce.
Health & Safety
We are committed to the health and safety of our employees. The environment we provide is based on our vision to create a working environment that places the highest value on the welfare of our employees, to instill a sense of ownership and to embrace excellence in safety, production and quality of work being done.
| |
● |
Our goals are simple: to create added value for our customers through best in class performance in environmental, health and safety practices. We pledge to place the safety and well-being of our employees first and to embody honesty and integrity in the pursuit of our vision of creating a world class safety culture. |
| |
● |
We are committed to providing world-class products and services that minimize harm to the environment and public health. We are committed not only in regard to our products to our customers but also in the way we conduct internal operations. We look to preserve the environment and will conduct business where feasible in an environmentally, sustainable way. |
Financing Program
We are party to a financing program in which certain distributors may elect to finance their purchases from us through a third party financing company. We provide the third party financing company recourse against us regarding the collectability of the receivable under the program due to the fact that if the third party financing company is unable to collect from the distributor the amounts due in respect of the product financed, we would be obligated to repurchase any remaining inventory related to the product financed and reimburse any legal fees incurred by the financing company. During the years ended December 31, 2022, 2021 and 2020, distributors financed purchases of $15.8 million, $10.5 million and $7.6 million through this financing program, respectively. At both December 31, 2022 and December 31, 2021, there were no uncollectible outstanding receivables related to sales financed under the financing program. The amount owed by our distributors to the third party financing company under this program at December 31, 2022 and 2021 was $16.1 million and $8.3 million, respectively. We were not required to repurchase repossessed inventory for the years ended December 31, 2022, 2021 and 2020.
In the past, minimal losses have been incurred under this agreement. However, an adverse change in distributor retail sales could cause this situation to change and thereby require us to repurchase repossessed units. Any repossessed units are inspected to ensure they are current, unused product and are restocked and resold.
Intellectual Property
We maintain patents relating to snowplow mounts, assemblies, hydraulics, electronics and lighting systems, brooms, sand, salt and fertilizer spreader assemblies, reel handlers and carriers and shelving systems. Patents are valid for the longer period of 17 years from issue date or 20 years from filing date. The duration of the patents we currently possess range between less than one year and 18 years of remaining life. Our patent applications date from 2005 through 2022.
We rely on a combination of patents, trade secrets and trademarks to protect certain of the proprietary aspects of our business and technology. We hold approximately 44 U.S. registered trademarks (including the trademarks WESTERN®, FISHER®, DEJANA®, BLIZZARD®, SNOWEX®, TURFEX®, SWEEPEX®, HENDERSON® and BRINEXTREME®) 13 Canadian registered trademarks, 5 European trademarks, 7 Chinese trademarks, 56 U.S. issued patents, and 4 Canadian patents.
Raw Materials
We have recently experienced increased commodity costs due to market conditions causing the inflation of steel prices. Historically, we have mitigated, and we currently expect to continue to mitigate, commodity cost increases in part by engaging in proactive vendor negotiations, reviewing alternative sourcing options, substituting materials, engaging in internal cost reduction efforts, and increasing prices on some of our products, all as appropriate. See the section titled “–Overview” in Management’s Discussion and Analysis of Financial Condition and Results of Operations below for further discussion.
Most of the components of our products are also affected by commodity cost pressures and are commercially available from a number of sources. In 2022 and 2021, we experienced no significant work stoppages because of shortages of raw materials or commodities, although we did have intermittent shutdowns of various facilities in our Work Truck Solutions segment due to other supply chain disruptions. The highest raw material and component costs are generally for steel, which we purchase from several suppliers.
Government Regulation
Our operations are subject to certain federal, state and local laws and regulations relating to, among other things, climate change, the generation, storage, handling, emission, transportation, disposal and discharge of hazardous and non‑hazardous substances and materials into the environment, the manufacturing of motor vehicle accessories, and employee health and safety. Management believes that the Company’s business is operated in material compliance with all such regulations.
Other Information
We were formed as a Delaware corporation in 2004. We maintain a website with the address www.douglasdynamics.com. We are not including the information contained on our website as part of, or incorporating it by reference into, this report. We make available free of charge (other than an investor’s own Internet access charges) through our website our Annual Report on Form 10‑K, quarterly reports on Form 10‑Q and current reports on Form 8‑K, and amendments to these reports, as soon as reasonably practicable after we electronically file such material with, or furnish such material to, the Securities and Exchange Commission (“SEC”). For further information regarding our geographic areas see the Summary of Significant Accounting Policies as discussed in Note 2 to our audited consolidated financial statements included elsewhere in this Annual Report on Form 10‑K.
Item 1A. Risk Factors
The Company operates in an environment that involves numerous known and unknown risks and uncertainties. Our business, prospects, financial condition and operating results could be materially adversely affected by any of these risks, as well as other risks not currently known to us or that we currently consider immaterial. The risks described below highlight some of the factors that have affected, and in the future could affect our operations.
Risks Related to Weather and Seasonality
Our results of operations for our Work Truck Attachments segment and to a lesser extent our Work Truck Solutions segment depend primarily on the level, timing and location of snowfall. As a result, a decline in snowfall levels in multiple regions for an extended time, including as a result of climate change, could cause our results of operations to decline and adversely affect our ability to generate cash flow.
As a manufacturer through our Work Truck Attachments segment of snow and ice control equipment for light trucks and related parts and accessories, our sales depend primarily on the level, timing and location of snowfall in the regions in which we offer our products. A low level or lack of snowfall in any given year in any of the snow‑belt regions in North America (primarily the Midwest, East and Northeast regions of the United States as well as all provinces of Canada) will likely cause sales of our Work Truck Attachments products and a portion of our Work Truck Solutions products to decline in such year as well as the subsequent year, which in turn may adversely affect our results of operations and ability to generate cash flow. See “Management’s Discussion and Analysis of Financial Condition and Results of Operations—Seasonality and Year‑to‑Year Variability.” A sustained period of reduced snowfall events in one or more of the geographic regions in which we offer our products could cause our results of operations to decline and adversely affect our ability to generate cash flow. If unfavorable weather conditions are exacerbated by climate change or otherwise, our results of operations may be affected to a greater degree than we have previously experienced.
The year‑to‑year variability of our Work Truck Attachments segment can cause our results of operations and financial condition to be materially different from year‑to‑year and the seasonality of our Work Truck Attachments segment can cause our results of operations and financial condition to be materially different from quarter‑to‑quarter.
Because our Work Truck Attachments segment depends on the level, timing and location of snowfall, our results of operations vary from year‑to‑year. Additionally, because the annual snow season typically only runs from October 1 through March 31, our distributors typically purchase our Work Truck Attachments products during the second and third quarters. As a result, we operate in a seasonal business. We not only experience seasonality in our sales, but also experience seasonality in our working capital needs. Consequently, our results of operations and financial condition of our Work Truck Attachments segment can vary from year‑to‑year, as well as from quarter‑to‑quarter, which could affect our ability to generate cash flow. If we are unable to effectively manage the seasonality and year‑to‑year variability of our Work Truck Attachments segment, our results of operations, financial condition and ability to generate cash flow may be adversely affected.
Risks Related to Economic Conditions
If economic conditions in the United States deteriorate, or if spending by governmental agencies is limited or reduced, our results of operations, financial condition and ability to generate cash flow may be adversely affected.
Historically, demand for snow and ice control equipment for light and heavy duty trucks as well as upfitted vehicles has been influenced by general economic conditions in the United States, as well as local economic conditions in the snow-belt regions in North America.
The global outbreak of COVID-19 in 2020 severely restricted the level of economic activity in North America. In response to this outbreak, the governments of many countries, states, cities and other geographic regions took preventative or protective actions, such as imposing restrictions on travel and business operations. These measures have and are expected to continue to have significant adverse impacts on domestic and foreign economies of uncertain severity and duration. It is likely that the continued spread of COVID-19 and its lingering impact may cause a further economic slowdown, and it is possible that it could cause a global recession.
Weakened economic conditions and limited or reduced government spending (including as a result of the COVID-19 pandemic) may cause both our Work Truck Attachments and Work Truck Solutions end-users to delay purchases of replacement snow and ice control equipment and upfit vehicles and instead repair their existing equipment and vehicles, leading to a decrease in our sales of new equipment and upfitted vehicles. Weakened economic conditions and limited or reduced governmental spending may also cause our end-users to delay their purchases of new light and heavy duty trucks. Because our end-users tend to purchase new snow and ice control equipment concurrent with their purchase of new light or heavy duty trucks, their delay in purchasing new light or heavy duty trucks can also result in the deferral of their purchases of new snow and ice control equipment. The deferral of new equipment purchases during periods of weak economic conditions or limited or reduced government spending may negatively affect our results of operations, financial condition and ability to generate cash flow.
Weakened economic conditions or limited or reduced government spending may also cause both our Work Truck Attachments and Work Truck Solutions end-users to consider price more carefully in selecting new snow and ice control equipment and upfit vehicles, respectively. Historically, considerations of quality and service have outweighed considerations of price, but in a weak economy, or an environment of constrained government spending, price may become a more important factor. Any refocus away from quality in favor of cheaper equipment could cause end-users to shift away from our products to less expensive competitor products, or to shift away from our more profitable products to our less profitable products, which in turn would adversely affect our results of operations and our ability to generate cash flow.
Weakened economic conditions may lead to significant inflation in raw materials and components, labor, benefits, freight, and other areas, which would adversely affect our results of operations and our ability to generate cash flow.
The COVID-19 pandemic could continue to have an adverse effect on our business, financial condition, results of operations and cash flows
As a result of the COVID-19 pandemic, and the market volatility and other economic implications associated with it, our business, financial condition, results of operations and cash flows have been adversely impacted in the years ended December 31, 2022, 2021, and 2020, and may be significantly impacted in future years. It may be more difficult to collect from customers as a result of customer bankruptcy or other hardships. Supply chains may continue to be disrupted which could raise prices and impact our ability to obtain inventory timely. During the years ended December 31, 2022, 2021 and 2020, we faced supply chain disruptions and additional difficulty obtaining chassis and other inventory, which we attribute in part to the impacts of the COVID-19 pandemic, and supply chains may continue to be disrupted which could adversely affect our results. We preventatively and voluntarily closed our facilities on March 18, 2020, suspending production and shipments at all of our locations, which negatively impacted sales volumes and profitability during the shutdown period. Throughout the second quarter of 2020, we slowly ramped up production at various facilities as appropriate and have since returned to full production levels. We incurred certain overhead and other costs during the shutdown period that were not capitalized into inventory.
The COVID-19 pandemic has impacted, and may continue to impact, our office locations and our manufacturing and servicing facilities, as well as those of our third party vendors, including the effects of facility closures, reductions in operating hours and other social distancing efforts. For example, we enacted temporary shutdown of certain of our facilities in the first and second quarters of 2020 to protect the health and safety of our employees, customers, partners and the surrounding communities. We slowly ramped up production during the second quarter, and are currently at full production levels. Although our operations are generally viewed as essential services in the geographies in which we operate, we can give no assurance that our operations will continue to be classified as essential in each of the jurisdictions in which we operate.
We may have challenges in short-term liquidity which could impact our ability to fund working capital needs. If our access to capital were to become significantly constrained or if costs of capital increased significantly due the impact of COVID-19, including volatility in the capital markets, a reduction in our credit ratings or other factors, results of operations and cash flows could be adversely affected.
We are not able to predict the full impact of the pandemic on our future financial results as the situation remains unpredictable. The extent to which the COVID-19 pandemic impacts our financial condition will depend on future developments that are highly uncertain and cannot be predicted, including new information that may emerge concerning the severity of COVID-19, the longevity of COVID-19, the impact of COVID-19 on economic activity, and the actions to contain its impacts on public health and the global economy.
The price of steel, a commodity necessary to manufacture our products, is highly variable. If the price of steel increases, our gross margins could decline.
Steel is a significant raw material used to manufacture our products. During 2022, our raw steel purchases were in amounts equivalent to approximately 13% of our revenue. During 2021, our raw steel purchases were in amounts equivalent to approximately 12% of our revenue. During 2020, our raw steel purchases were in amounts equivalent to approximately 10% of our revenue. The steel industry is highly cyclical in nature, and steel prices have been volatile in recent years and may remain volatile in the future. Steel prices are influenced by numerous factors beyond our control, including general economic conditions domestically and internationally as a result of the lingering impacts of the COVID-19 pandemic and otherwise, the availability of raw materials, competition, labor costs, freight and transportation costs, production costs, tariffs and other trade restrictions. For example, in March 2018, the United States imposed an additional 25% tariff under Section 232 of the Trade Expansion Act of 1962, as amended, on steel products imported into the Unites States. Steel prices are volatile and may also increase as a result of increased demand from the automobile and consumer durable sectors. If the price of steel increases, our variable costs may increase. We may not be able to mitigate these increased costs through the implementation of permanent price increases or temporary invoice surcharges, especially if economic conditions are weak and our distributors and end‑users become more price sensitive. If we are unable to successfully mitigate such cost increases in the future, our gross margins could decline.
If petroleum prices increase, then our results of operations could be adversely affected.
Petroleum prices have fluctuated significantly in recent years. Prices and availability of petroleum products are subject to political, economic and market factors that are outside of our control. Political events in petroleum‑producing regions, including the conflict in Ukraine, as well as hurricanes and other weather‑related events may cause the price of fuel to increase. If the price of fuel increases, the demand for our products may decline and transportation and freight costs may increase, which would adversely affect our financial condition and results of operations.
Global climate change and related emphasis on ESG matters by various stakeholders could negatively affect our business.
Increased public awareness and concern regarding global climate change may result in more regional and/or federal requirements to reduce or mitigate the effects of greenhouse gas emissions. There continues to be a lack of consistent climate legislation, which creates economic and regulatory uncertainty. Such regulatory uncertainty extends to our product portfolio and overall costs of compliance, which may impact the demand for our products and/ or require us to make increased capital expenditures to meet new standards and regulations. Further, our customers and the markets we serve may impose emissions or other environmental standards upon us through regulation, market-based emissions policies or consumer preference that we may not be able to timely meet, or which may not be economically feasible for us, due to the required level of capital investment or technological advancement.
There is a growing consensus that greenhouse gas emissions are linked to global climate changes. Climate changes, such as extreme weather conditions, create financial risk to our business. For example, the demand for our products and services may be affected by unseasonable weather conditions. Climate changes could also disrupt our operations by impacting the availability and cost of materials needed for manufacturing and could increase insurance and other operating costs. We could also face indirect financial risks passed through the supply chain, and process disruptions due to climate changes could result in price modifications for our products and the resources needed to produce them.
Furthermore, customer, investor, and employee expectations in areas such as the environment, social matters and corporate governance (ESG) have been rapidly evolving and increasing. Specifically, certain customers are requiring information on our environmental sustainability plans and commitments, which we have not yet released publicly as of the date of this filing. There can be no assurance of the extent to which any of our future plans or commitments will be achieved, or that any investments we make in furtherance of achieving any such plans, targets, goals or other commitments will meet customer, investor, employee or other stakeholder expectations and desires or any legal standards regarding sustainability performance.
Additionally, the enhanced stakeholder focus on ESG issues requires the continuous monitoring of various and evolving standards and the associated reporting requirements. A failure to adequately meet stakeholder expectations may result in the loss of business, diluted market valuation, an inability to attract and retain customers or an inability to attract and retain top talent.
Risks Related to our Business and Operations
We depend on outside suppliers and original equipment manufacturers who may be unable to meet our volume and quality requirements, and we may be unable to obtain alternative sources.
We purchase certain components essential to our snowplows and sand and salt spreaders from outside suppliers, including off‑shore sources. We also have OEM partners that supply truck chassis used in our truck upfitting operations across both segments. Most of our key supply arrangements can be discontinued at any time. A supplier may encounter delays in the production and delivery of such products and components or may supply us with products and components that do not meet our quality, quantity or cost requirements. In addition, as was the case in 2022, 2021, and 2020, an OEM may encounter difficulties and may be unable to deliver truck chassis according to our production needs, as a result of computer chip shortages or otherwise, which may result in the deferral of sales to future periods. Additionally, a supplier may be forced to discontinue operations. Any discontinuation or interruption in the availability of quality products, components or truck chassis from one or more of our suppliers may result in increased production costs, delays in the delivery of our products and lost end‑user sales, which could have an adverse effect on our business and financial condition.
We have continued to increase the number of our off‑shore suppliers. Our increased reliance on off‑shore sourcing may cause our business to be more susceptible to the impact of natural disasters, global health epidemics, war and other geopolitical conflict, and other factors that may disrupt the transportation systems or shipping lines used by our suppliers, a weakening of the dollar over an extended period of time and other uncontrollable factors such as changes in foreign regulation, tariffs or economic conditions. In addition, reliance on off‑shore suppliers may make it more difficult for us to respond to sudden changes in demand because of the longer lead time to obtain components from off‑shore sources. We may be unable to mitigate this risk by stocking sufficient materials to satisfy any sudden or prolonged surges in demand for our products. If we cannot satisfy demand for our products in a timely manner, our sales could suffer as distributors can cancel purchase orders without penalty until shipment.
Security breaches and other disruptions could compromise our information and expose us to liability, which would cause our business and reputation to suffer.
In the ordinary course of our business, we collect and store sensitive data, including our proprietary business information and that of our customers, suppliers and business partners, as well as personally identifiable information of our customers and employees, in our data centers and on our networks. The secure processing, maintenance and transmission of this information is critical to our operations and business strategy. Despite our security measures, our information technology and infrastructure may be vulnerable to malicious attacks or breached due to employee error, malfeasance or other disruptions, including as a result of rollouts of new systems. In addition, we currently have portions of our workforce working remotely, which may heighten these risks. Any such breach could compromise our networks and the information stored there could be accessed, publicly disclosed, lost or stolen. Any such access, disclosure or other loss of information could result in legal claims or proceedings and/or regulatory penalties, disrupt our operations, damage our reputation, and/or cause a loss of confidence in our products and services, which could adversely affect our business.
We are heavily dependent on our senior management team. If we are unable to retain, attract, and motivate qualified employees, it may adversely affect our business.
Our continued success depends on the retention, recruitment and continued contributions of key management, finance, sales and marketing personnel, some of whom could be difficult to replace. Our success is largely dependent upon our senior management team. The loss of any one or more of such persons could have an adverse effect on our business and financial condition. Our ability to implement our business plan is dependent on our retaining, hiring, and training a large number of qualified employees every year. Our results of operations could be adversely affected by increased costs due to higher competition for employees, higher employee turnover, or increased employee benefit costs.
Our failure to maintain good relationships with our customers and distributors, the loss or consolidation of our distributor base or the actions or inactions of our distributors could have an adverse effect on our results of operations and our ability to generate cash flow.
We depend on a network of truck equipment distributors to sell, install and service our products and upfitted vehicles. Nearly all of these sales and service relationships are at will, so almost all of our distributors could discontinue the sale and service of our products and upfitted vehicles at any time, and those distributors that primarily sell our products and upfitted vehicles may choose to sell competing products or vehicles at any time. Further, difficult economic or other circumstances could cause any of our distributors to discontinue their businesses. Moreover, if our distributor base were to consolidate or if any of our distributors were to discontinue their business, competition for the business of fewer distributors would intensify. If we do not maintain good relationships with our distributors and customers, or if we do not provide product or upfit offerings and pricing that meet the needs of our distributors and customers, we could lose a substantial amount of our distributor and customer base. A loss of a substantial portion of our distributor and customer base could cause our sales to decline significantly, which would have an adverse effect on our results of operations and ability to generate cash flow.
In addition, our distributors may not provide timely or adequate service to our end‑users. If this occurs, our brand identity and reputation may be damaged, which would have an adverse effect on our results of operations and ability to generate cash flow.
Lack of available financing options for our end‑users or distributors may adversely affect our sales volumes.
Our end‑user base in our Work Truck Attachments segment is highly concentrated among professional snowplowers who comprise over 50% of our end‑users, many of whom are individual landscapers who remove snow during the winter and landscape during the rest of the year, rather than large, well‑capitalized corporations. These end‑users often depend upon credit to purchase our Work Truck Attachments products. If credit is unavailable on favorable terms or at all, then these end‑users may not be able to purchase our Work Truck Attachments products from our distributors, which would in turn reduce sales and adversely affect our results of operations and ability to generate cash flow.
In addition, because our distributors, like our end‑users, rely on credit to purchase our products, if our distributors are not able to obtain credit, or access credit on favorable terms, we may experience delays in payment or nonpayment for delivered products. Further, if our distributors are unable to obtain credit or access credit on favorable terms, they could experience financial difficulties or bankruptcy and cease purchases of our products altogether. Thus, if financing is unavailable on favorable terms or at all, our results of operations and ability to generate cash flow would be adversely affected.
We do not sell our products under long‑term purchase contracts, and sales of our products are significantly impacted by factors outside of our control; therefore, our ability to estimate demand is limited.
We do not enter into long‑term purchase contracts with our distributors and the purchase orders we receive may be cancelled without penalty until shipment. Therefore, our ability to accurately predict future demand for our products is limited. Nonetheless, we attempt to estimate demand for our products for purposes of planning our annual production levels and our long‑term product development and new product introductions. We base our estimates of demand on our own market assessment, snowfall figures, quarterly field inventory surveys and regular communications with our distributors. Because wide fluctuations in the level, timing and location of snowfall, economic conditions and other factors may occur, each of which is out of our control, our estimates of demand may not be accurate. Underestimating demand could result in procuring an insufficient amount of materials necessary for the production of our products, which may result in increased production costs, delays in product delivery, missed sale opportunities and a decrease in customer satisfaction. Overestimating demand could result in the procurement of excessive supplies, which could result in increased inventory and associated carrying costs.
We face competition from other companies in our industry, and if we are unable to compete effectively with these companies, it could have an adverse effect on our sales and profitability. Price competition among our distributors and customers could negatively affect our market share.
In our Work Truck Attachments segment, we primarily compete with regional manufacturers of snow and ice control equipment for light trucks. While we are the most geographically diverse company in our industry, we may face increasing competition in the markets in which we operate. Additionally, in our Work Truck Solutions segment, we compete with other market leaders in the municipal snow and ice manufacturing and truck upfit industries. In saturated markets, price competition may lead to a decrease in our market share or a compression of our margins, both of which would affect our profitability. Moreover, current or future competitors may grow their market share and develop superior service and may have or may develop greater financial resources, lower costs, superior technology or more favorable operating conditions than we maintain. As a result, competitive pressures we face may cause price reductions for our products, which would affect our profitability or result in decreased sales and operating income. Additionally, saturation of the markets in which we compete or channel conflicts among our brands and shifts in consumer preferences may increase these competitive pressures or may result in increased competition among our distributors and affect our sales and profitability. In addition, price competition among the distributors that sell our products could lead to significant margin erosion among our distributors, which could in turn result in compressed margins or loss of market share for us. Management believes that, after ourselves, the next largest competitors in the market for snow and ice control equipment for light trucks are The Toro Company (the manufacturer of the Boss brand of snow and ice control equipment) and Buyers Products Company, and that these companies represent our primary competitors for light truck market share for our Work Truck Attachments segment. Management believes that, after ourselves, the next largest competitors in the market for snow and ice control equipment for heavy trucks are Monroe and Viking, and that these companies represent our primary competitors for heavy truck market share for our Work Truck Solutions segment. Management believes that, other regional market leaders in the truck upfitting industry are Knapheide, Reading, Palfleet and Autotruck, and that these companies represent our primary competitors for the upfit market share for our Work Truck Solutions segment.
The statements regarding our industry, market positions and market share in this filing are based on our management’s estimates and assumptions. While we believe such statements are reasonable, such statements have not been independently verified.
Information contained in this Annual Report on Form 10‑K concerning the snow and ice control equipment and truck upfitting industries, our general expectations concerning these industries and our market positions and other market share data regarding the industries are based on estimates our management prepared using end‑user surveys, anecdotal data from our distributors and distributors that carry our competitors’ products, our results of operations and management’s past experience, and on assumptions made, based on our management’s knowledge of this industry, all of which we believe to be reasonable. These estimates and assumptions are inherently subject to uncertainties, especially given the year‑to‑year variability of snowfall and the difficulty of obtaining precise information about our competitors, and may prove to be inaccurate. In addition, we have not independently verified the information from any third‑party source and thus cannot guarantee its accuracy or completeness, although management also believes such information to be reasonable. Our actual operating results may vary significantly if our estimates and outlook concerning the industry, snowfall patterns, our market positions or our market shares turn out to be incorrect.
We are subject to product liability claims, product quality issues, and other litigation from time to time that could adversely affect our operating results or financial condition.
The manufacture, sale and usage of our products expose us to a risk of product liability claims. If our products are defective or used incorrectly by our end‑users, then injury may result, giving rise to product liability claims against us. If a product liability claim or series of claims is brought against us for uninsured liabilities or in excess of our insurance coverage, and it is ultimately determined that we are liable, our business and financial condition could suffer. Any losses that we may suffer from any liability claims, and the effect that any product liability litigation may have upon the reputation and marketability of our products, may divert management’s attention from other matters and may have a negative impact on our business and operating results. Additionally, we could experience a material design or manufacturing failure in our products, a quality system failure or other safety issues, or heightened regulatory scrutiny that could warrant a recall of some of our products. A recall of some of our products could also result in increased product liability claims. Any of these issues could also result in loss of market share, reduced sales, and higher warranty expense.
Risks Related to Execution of Strategy
We may be unable to identify, complete or benefit from strategic transactions.
Our long‑term growth strategy includes building value for our company through a variety of methods. These methods may include acquisition of, investment in, or joint ventures involving, complementary businesses. We cannot assure that we will be able to identify suitable parties for these transactions. If we are unable to identify suitable parties for strategic transactions we may not be able to capitalize on market opportunities with existing and new customers, which could inhibit our ability to gain market share. Even if we identify suitable parties to participate in these transactions, we cannot assure that we will be able to make them on commercially acceptable terms, if at all.
In July 2016, we acquired Dejana. In December 2014, we acquired Henderson. We may not be able to achieve the projected financial performance or incur unexpected costs or liabilities as a result of these transactions. In addition, if in the future we acquire another company or its assets, it may be difficult to assimilate the acquired businesses, products, services, technologies and personnel into our operations. These difficulties could disrupt our ongoing business, distract our management and workforce, increase our expenses and adversely affect our operating results and ability to compete and gain market share. Mergers and acquisitions are inherently risky and are subject to many factors outside our control. No assurance can be given that any future acquisitions will be successful and will not materially adversely affect our business, operating results, or financial condition. In addition, we may incur debt or be required to issue equity securities to pay for future acquisitions or investments. The issuance of any equity securities could be dilutive to our stockholders. We also may need to make further investments to support any acquired company and may have difficulty identifying and acquiring appropriate resources. If we divest or otherwise exit certain portions of our business in connection with a strategic transaction, we may be required to record additional expenses, and our estimates with respect to the useful life and ultimate recoverability of our carrying basis of assets, including goodwill and purchased intangible assets, could change.
If we are unable to enforce, maintain or continue to build our intellectual property portfolio, or if others invalidate our intellectual property rights, our competitive position may be harmed.
Our patents relate to snowplow mounts, assemblies, hydraulics, electronics and lighting systems, brooms, sand, salt and fertilizer spreader assemblies, reel handlers and carriers and shelving systems. Patents are valid for the longer period of 17 years from issue date or 20 years from filing date. The duration of the patents we currently possess range between less than one year and 18 years of remaining life. Our patent applications date from 2005 through 2022.
We rely on a combination of patents, trade secrets and trademarks to protect certain of the proprietary aspects of our business and technology. We hold approximately 44 U.S. registered trademarks (including the trademarks WESTERN®, FISHER®, DEJANA®, BLIZZARD®, SNOWEX®, TURFEX®, SWEEPEX®, HENDERSON® and BRINEXTREME®) 13 Canadian registered trademarks, 5 European trademarks, 7 Chinese trademarks, 56 U.S. issued patents, and 4 Canadian patents. Although we work diligently to protect our intellectual property rights, monitoring the unauthorized use of our intellectual property is difficult, and the steps we have taken may not prevent unauthorized use by others. In addition, in the event a third party challenges the validity of our intellectual property rights, a court may determine that our intellectual property rights may not be valid or enforceable. An adverse determination with respect to our intellectual property rights may harm our business prospects and reputation. Third parties may design around our patents or may independently develop technology similar to our trade secrets. The failure to adequately build, maintain and enforce our intellectual property portfolio could impair the strength of our technology and our brands, and harm our competitive position. Although we have no reason to believe that our intellectual property rights are vulnerable, previously undiscovered intellectual property could be used to invalidate our rights.
If we are unable to develop new products or improve upon our existing products on a timely basis, it could have an adverse effect on our business and financial condition.
We believe that our future success depends, in part, on our ability to develop on a timely basis new technologically advanced products or improve upon our existing products in innovative ways that meet or exceed our competitors’ product and upfit offerings. Continuous product innovation, including through vertical integration efforts, ensures that our consumers have access to the latest products and features when they consider buying snow and ice control equipment and truck upfits. Maintaining our market position will require us to continue to invest in research and development and sales and marketing. Product development requires significant financial, technological and other resources. We may be unsuccessful in making the technological advances necessary to develop new products or improve our existing products to maintain our market position. Industry standards, end‑user expectations or other products may emerge that could render one or more of our products less desirable or obsolete. If any of these events occur, it could cause decreases in sales, a failure to realize premium pricing and an adverse effect on our business and financial condition.
Our dividend policy may limit our ability to pursue growth opportunities.
If we continue to pay dividends at the level contemplated by our dividend policy, as in effect on the date of this filing, or if we increase the level of our dividend payments in the future, we may not retain a sufficient amount of cash to finance growth opportunities, meet any large unanticipated liquidity requirements, execute repurchases under our stock repurchase program or fund our operations in the event of a significant business downturn. In addition, because a significant portion of cash available will be distributed to holders of our common stock under our dividend policy, our ability to pursue any material expansion of our business, including through acquisitions, increased capital spending or other increases of our expenditures, will depend more than it otherwise would on our ability to obtain third party financing. We cannot assure you that such financing will be available to us at all, or at an acceptable cost. If we are unable to take timely advantage of growth opportunities, our future financial condition and competitive position may be harmed, which in turn may adversely affect the market price of our common stock.
Risks Related to Legal, Compliance and Regulatory Matters
We are subject to complex laws and regulations, including environmental and safety regulations that can adversely affect the cost, manner or feasibility of doing business.
Our operations are subject to certain federal, state and local laws and regulations relating to, among other things, climate change, the generation, storage, handling, emission, transportation, disposal and discharge of hazardous and non‑hazardous substances and materials into the environment, the manufacturing of motor vehicle accessories and employee health and safety. We cannot be certain that existing and future laws and regulations and their interpretations will not harm our business or financial condition. We currently make and may be required to make large and unanticipated capital expenditures to comply with environmental and other regulations, such as:
| |
● |
Applicable motor vehicle safety standards established by the National Highway Traffic Safety Administration; |
| |
● |
Emissions or other standards related to climate change as established by international, federal, state and local regulatory bodies; |
| |
● |
Reclamation and remediation and other environmental protection; and |
| |
● |
Standards for workplace safety established by the Occupational Safety and Health Administration. |
While we monitor our compliance with applicable laws and regulations and attempt to budget for anticipated costs associated with compliance, we cannot predict the future cost of such compliance. In 2022, the amount expended for such compliance was insignificant, but we could incur material expenses in the future in the event of future legislation changes or unforeseen events, such as a workplace accident or environmental discharge, or if we otherwise discover we are in non‑compliance with an applicable regulation. In addition, under these laws and regulations, we could be liable for:
| |
● |
Product liability claims; |
| |
● |
Investigation and remediation of environmental contamination and other governmental sanctions such as fines and penalties; and |
| |
● |
Other environmental damages. |
Our operations could be significantly delayed or curtailed and our costs of operations could significantly increase as a result of regulatory requirements, restrictions or claims. We are unable to predict the ultimate cost of compliance with these requirements or their effect on our operations.
Provisions of Delaware law and our charter documents could delay or prevent an acquisition of us, even if the acquisition would be beneficial to you.
Provisions in our certificate of incorporation and bylaws may have the effect of delaying or preventing a change of control or changes in our management. These provisions include:
| |
● |
the absence of cumulative voting in the election of our directors, which means that the holders of a majority of our common stock may elect all of the directors standing for election; |
| |
● |
the ability of our Board of Directors to issue preferred stock with voting rights or with rights senior to those of our common stock without any further vote or action by the holders of our common stock; |
| |
● |
the division of our Board of Directors into three separate classes serving staggered three‑year terms; |
| |
● |
the ability of our stockholders to remove our directors is limited to cause and only by the vote of at least 662/3% of the outstanding shares of our common stock; |
| |
● |
the prohibition on our stockholders from acting by written consent and calling special meetings; |
| |
● |
the requirement that our stockholders provide advance notice when nominating our directors or proposing business to be considered by the stockholders at an annual meeting of stockholders; and |
| |
● |
the requirement that our stockholders must obtain a 662/3% vote to amend or repeal certain provisions of our certificate of incorporation. |
We are also subject to Section 203 of the Delaware General Corporation Law, which, subject to certain exceptions, prohibits us from engaging in any business combination with any interested stockholder, as defined in that section, for a period of three years following the date on which that stockholder became an interested stockholder. This provision, together with the provisions discussed above, could also make it more difficult for you and our other stockholders to elect directors and take other corporate actions, and could limit the price that investors might be willing to pay in the future for shares of our common stock.
Risks Related to Capital Structure
Our indebtedness could adversely affect our operations, including our ability to perform our obligations and generate cash flow.
As of December 31, 2022, we had approximately $207.7 million of senior secured indebtedness, no outstanding borrowings under our revolving credit facility and $99.5 million of borrowing availability under the revolving credit facility. We may also be able to incur substantial indebtedness in the future, including senior indebtedness, which may or may not be secured.
Our indebtedness could have important consequences, including the following:
| |
● |
We could have difficulty satisfying our debt obligations, and if we fail to comply with these requirements, an event of default could result; |
| |
● |
We may be required to dedicate a substantial portion of our cash flow from operations to required payments on indebtedness, thereby reducing the cash flow available to pay dividends, execute repurchases under our stock repurchase program or fund working capital, capital expenditures and other general corporate activities; |
| |
● |
Covenants relating to our indebtedness may restrict our ability to make distributions to our stockholders or execute repurchases under our stock repurchase program; |
| |
● |
Covenants relating to our indebtedness may limit our ability to obtain additional financing for working capital, capital expenditures and other general corporate activities, which may limit our flexibility in planning for, or reacting to, changes in our business and the industry in which we operate; |
| |
● |
We may be more vulnerable to general adverse economic and industry conditions; |
| |
● |
We may be placed at a competitive disadvantage compared to our competitors with less debt; and |
| |
● |
We may have difficulty repaying or refinancing our obligations under our senior credit facilities on their respective maturity dates. |
If any of these consequences occur, our financial condition, results of operations and ability to generate cash flow could be adversely affected. This, in turn, could negatively affect the market price of our common stock, and we may need to undertake alternative financing plans, such as refinancing or restructuring our debt, selling assets, reducing or delaying capital investments or seeking to raise additional capital. We cannot assure you that any refinancing would be possible, that any assets could be sold, or, if sold, of the timing of the sales and the amount of proceeds that may be realized from those sales, or that additional financing could be obtained on acceptable terms, if at all.
Our variable rate indebtedness subjects us to interest rate risk, which could cause our debt service obligations to increase significantly and could impose adverse consequences.
Certain of our borrowings, including our term loan and any revolving borrowings under our senior credit facilities, are at variable rates of interest and expose us to interest rate risk. In addition, the interest rate on any revolving borrowings is subject to an increase in the interest rate if the average daily availability under our revolving credit facility falls below a certain threshold. If interest rates increase, our debt service obligations on the variable rate indebtedness would increase even though the amount borrowed remained the same, and our net income and cash flows would correspondingly decrease.
Our senior credit facilities impose restrictions on us, which may also prevent us from capitalizing on business opportunities and taking certain corporate actions. One of these facilities also includes minimum availability requirements, which if unsatisfied, could result in liquidity events that may jeopardize our business.
Our senior credit facilities contain, and future debt instruments to which we may become subject may contain, covenants that limit our ability to engage in activities that could otherwise benefit our company. Under the credit facilities, these covenants include restrictions on our ability to:
| |
● |
incur, assume or permit to exist additional indebtedness or contingent obligations; |
| |
● |
incur liens and engage in sale and leaseback transactions; |
| |
● |
make loans and investments in excess of agreed upon amounts; |
| |
● |
declare dividends, make payments or redeem or repurchase capital stock in excess of agreed upon amounts and subject to certain other limitations; |
| |
● |
engage in mergers, acquisitions and other business combinations; |
| |
● |
prepay, redeem or purchase certain indebtedness or amend or alter the terms of our indebtedness; |
| |
● |
make further negative pledges; |
| |
● |
create restrictions on distributions by subsidiaries; |
| |
● |
change our fiscal year; |
| |
● |
engage in activities other than, among other things, incurring the debt under our new senior credit facilities and the activities related thereto, holding our ownership interest in Douglas Dynamics, LLC, making restricted payments, including dividends and repurchasing equity, permitted by our senior credit facilities and conducting activities related to our status as a public company; |
| |
● |
amend or waive rights under certain agreements; |
| |
● |
transact with affiliates or our stockholders; and |
| |
● |
alter the business that we conduct. |
Our ability to comply with the covenants contained in our senior credit facilities or in the agreements governing our future indebtedness, and our ability to avoid liquidity events, may be affected by events, or our future performance, which are subject to factors beyond our control, including prevailing economic, financial, industry and weather conditions, such as the level, timing and location of snowfall and general economic conditions in the snowbelt regions of North America. A failure to comply with these covenants could result in a default under our senior credit facilities, which could prevent us from paying dividends, repurchasing equity, borrowing additional amounts and using proceeds of our inventory and accounts receivable, and also permit the lenders to accelerate the payment of such debt. If any of our debt is accelerated or if a liquidity event (or event of default) occurs that results in collateral proceeds being applied to reduce such debt, we may not have sufficient funds available to repay such debt and our other obligations, in which case, our business could be halted and such lenders could proceed against any collateral securing that debt. Further, if the lenders accelerate the payment of the indebtedness under our senior credit facilities, our assets may not be sufficient to repay in full the indebtedness under our senior credit facilities and our other indebtedness, if any. We cannot assure you that these covenants will not adversely affect our ability to finance our future operations or capital needs to pursue available business opportunities or react to changes in our business and the industry in which we operate.
Item 1B. Unresolved Staff Comments
Not applicable.
Item 2. Properties
Our significant facilities by location, ownership, and function as of December 31, 2022 are as follows:
| Location |
|
Ownership |
|
Products / Use |
| Milwaukee, Wisconsin |
|
Leased |
|
Corporate headquarters |
| Milwaukee, Wisconsin (1) |
|
Owned |
|
Work Truck Attachments |
| Albany, New York |
|
Leased |
|
Work Truck Solutions |
| Baltimore, Maryland (1) |
|
Leased |
|
Work Truck Solutions |
| Bucyrus, Ohio |
|
Leased |
|
Work Truck Solutions |
| Chalfont, Pennsylvania |
|
Leased |
|
Work Truck Solutions |
| Cinnaminson, New Jersey |
|
Leased |
|
Work Truck Solutions |
| Fulton, Missouri |
|
Leased |
|
Work Truck Solutions |
| Huntley, Illinois |
|
Owned |
|
Work Truck Solutions |
| Kansas City, Missouri |
|
Leased |
|
Work Truck Solutions |
| Kenvil, New Jersey |
|
Leased |
|
Work Truck Solutions |
| Kings Park, New York (1) |
|
Leased |
|
Work Truck Solutions |
| Madison Heights, Michigan |
|
Owned |
|
Work Truck Attachments |
| Manchester, Iowa |
|
Owned |
|
Work Truck Solutions |
| Manchester, Iowa |
|
Leased |
|
Work Truck Solutions |
| Queensbury, New York |
|
Leased |
|
Work Truck Solutions |
| Rockland, Maine (1) |
|
Owned |
|
Work Truck Attachments |
| Smithfield, Rhode Island |
|
Leased |
|
Work Truck Solutions |
| Watertown, New York |
|
Leased |
|
Work Truck Solutions |
| China |
|
Leased |
|
Sourcing Office |
(1) – Two facilities.
Item 3. Legal Proceedings
In the ordinary course of business, we are engaged in various litigation primarily including product liability and intellectual property disputes. However, management does not believe that any current litigation is material to our operations or financial position. In addition, we are not currently party to any climate change or environmental‑related claims or legal matters.
Item 4. Mine Safety Disclosures
Not applicable.
Information about our Executive Officers
Our executive officers as of February 21, 2023 were as follows:
Management
| Name |
Age |
|
Position |
| Robert McCormick |
62 |
|
President and Chief Executive Officer |
| Sarah Lauber |
51 |
|
Chief Financial Officer & Secretary |
| Mark Van Genderen |
54 |
|
President, Work Truck Attachments |
| Linda Evans |
56 |
|
Vice President, Human Resources |
Robert McCormick has been serving as our President and Chief Executive Officer and as director since January 2019. Previously, Mr. McCormick served as our Chief Operating Officer from August 2017 until January 2019. Prior to becoming Chief Operating Officer, Mr. McCormick served as our Executive Vice President and Chief Financial Officer from September 2004 through August 2017, as our Secretary from May 2005 through August 2017, as our Assistant Secretary from September 2004 to May 2005 and as our Treasurer from September 2004 through December 2010. Prior to joining us, Mr. McCormick served as President and Chief Executive Officer of Xymox Technology Inc. from 2001 to 2004. Prior to that, Mr. McCormick served in various capacities in the Newell Rubbermaid Corporation, including President from 2000 to 2001 and Vice President Group Controller from 1997 to 2000. Mr. McCormick is a member of the Board of Directors of Mayville Engineering Company, Inc.
Sarah Lauber has been serving as our Chief Financial Officer and Secretary since August 2017. Prior to joining us, Ms. Lauber served as Senior Vice President and Chief Financial Officer of Jason Industries, Inc., a global industrial manufacturing company, since January 2016 and as Jason Industries’ Chief Financial Officer since 2015. Prior to joining Jason Industries, Ms. Lauber served as Senior Vice President, Financial Planning and Analysis at Regal Rexnord Corporation (f/k/a Regal Beloit Corporation), a manufacturer of electric motors, electric motion controls, power generation and power transmission products, from 2011 until 2015. Ms. Lauber previously was employed by A.O. Smith Corporation’s Electrical Products Company (“EPC”) from 2002 until 2011 and held various roles, the latest of which was Chief Financial Officer from 2006 until EPC was acquired by Regal Rexnord in 2011. Ms. Lauber is a member of the Board of Directors of The Timken Company.
Mark Van Genderen has been serving as our President, Work Truck Attachments since January 2023. Prior to this role, he served as our President, Commercial Snow & Ice since September 2021 and Vice President of Business Development since November 2020. Prior to his time at Douglas Dynamics, Mr. Van Genderen spent 21 years in various leadership roles at the Harley-Davidson Motor Company, manufacturer of premium motorcycles. While at Harley-Davidson, he held a diverse range of responsibilities including leadership roles in manufacturing, product development, sales and marketing, finance, and dealer development. More recently, he led Harley-Davidson’s expansion in Latin America, the company’s parts and accessories product development function, and the riding gear and lifestyle apparel division including the company’s eCommerce business.
Linda Evans has been serving as our Vice President, Human Resources since June 2008 and became an executive officer in February 2021. Ms. Evans is an active member of the Society of Human Resources Management and has her Senior Professional HR (SPHR) certification. Prior to joining Douglas Dynamics, Ms. Evans served as the Director of Human Resources for Pentair Filtration from November 1998 to June 2008.
Executive officers are elected by, and serve at the discretion of, the Board of Directors. There are no family relationships between any of our directors or executive officers.
PART II
Item 5. Market for Registrant’s Common Equity, Related Stockholder Matters and Issuer Purchases of Equity Securities
Our Common Stock has been traded on the New York Stock Exchange since the second quarter of 2010 under the symbol “PLOW.”
At February 21, 2023, there were 50 registered record holders of our Common Stock.
In accordance with our dividend policy, dividends are declared and paid quarterly at the discretion of the board of directors. Additionally, special dividends may be declared and paid at the discretion of the board of directors. We paid quarterly dividends to the holders of our Common Stock in 2021 and 2022.
Item 12 of this Annual Report on Form 10-K contains certain information relating to the Company’s equity compensation plans.
The following information in this Item 5 of this Annual Report on Form 10‑K is not deemed to be “soliciting material” or to be “filed” with the SEC or subject to Regulation 14A or 14C under the Securities Exchange Act of 1934, as amended (the “Exchange Act”) or to the liabilities of Section 18 of the Exchange Act, and will not be deemed to be incorporated by reference into any filing under the Securities Act of 1933, as amended (the “Securities Act”) or the Exchange Act, except to the extent we specifically incorporate it by reference into such a filing.
The graph set forth below compares the cumulative total stockholder return on our common stock between January 1, 2017 and December 31, 2022, with the cumulative total return of The Dow Jones Industrial Average and Russell 2000 Index. This graph assumes the investment of $100 on January 1, 2017 in our common stock, the Dow Jones Industrial Average and Russell 2000 Index, and assumes the reinvestment of dividends. The Russell 2000 was chosen because we do not believe we can reasonably identify an industry index or specific peer group that would offer a meaningful comparison. The Russell 2000 represents a broad-based index of companies with similar market capitalization.
.
We did not sell any equity securities during 2022 in offerings that were not registered under the Securities Act.
Issuer Purchases of Equity Securities
On February 16, 2022, our Board of Directors authorized the purchase of up to $50.0 million in shares of common stock at market value (the "2022 repurchase plan"). This authorization does not have an expiration date. Repurchases under the program may be made in the open market, in privately negotiated transactions or otherwise, with the amount and timing of repurchases depending on market conditions and corporate needs. We may also, from time to time, enter into Rule 10b5-1 trading plans to facilitate repurchases of shares under this authorization. This program does not obligate us to acquire any particular amount of shares and the program may be extended, modified, suspended or discontinued at any time at the Company's discretion. Shares repurchased under the 2022 repurchase program were retired.
Total share repurchases under the 2022 repurchase plan for the year ended December 31, 2022 were as follows:
| Period |
|
Total number of shares purchased |
|
|
Average price paid per share |
|
|
Number of shares purchased as part of the publicly announced program |
|
|
Approximate dollar value of shares still available to be purchased under the program (000's) |
|
| 1/1/022 - 2/24/2022 |
|
|
- |
|
|
$ |
- |
|
|
|
- |
|
|
$ |
50,000 |
|
| 2/25/2022 - 3/9/2022 |
|
|
81,731 |
|
|
$ |
36.71 |
|
|
|
81,731 |
|
|
|
47,000 |
|
| 3/10/2022 - 3/31/2022 |
|
|
- |
|
|
$ |
- |
|
|
|
- |
|
|
|
47,000 |
|
| 4/1/2022 - 4/21/2022 |
|
|
89,357 |
|
|
$ |
33.57 |
|
|
|
89,357 |
|
|
|
44,000 |
|
| 4/22/2022 - 6/30/2022 |
|
|
- |
|
|
$ |
- |
|
|
|
- |
|
|
|
44,000 |
|
| 7/1/2022 - 7/31/2022 |
|
|
- |
|
|
$ |
- |
|
|
|
- |
|
|
|
44,000 |
|
| 8/1/2022 - 8/31/2022 |
|
|
- |
|
|
$ |
- |
|
|
|
- |
|
|
|
44,000 |
|
| 9/1/2022 - 9/30/2022 |
|
|
- |
|
|
$ |
- |
|
|
|
- |
|
|
|
44,000 |
|
| 10/1/2022 - 10/31/2022 |
|
|
- |
|
|
$ |
- |
|
|
|
- |
|
|
|
44,000 |
|
| 11/1/2022 - 11/30/2022 |
|
|
- |
|
|
$ |
- |
|
|
|
- |
|
|
|
44,000 |
|
| 12/1/2022 - 12/31/2022 |
|
|
- |
|
|
$ |
- |
|
|
|
- |
|
|
|
44,000 |
|
| Total |
|
|
171,088 |
|
|
$ |
35.07 |
|
|
|
171,088 |
|
|
$ |
44,000 |
|
| |
|
|
|
|
|
|
|
|
|
|
|
|
|
|
|
|
Item 6. [Reserved]
This item is no longer required as the Company as applied the amendment to Regulations S-K Item 301 contained in the Securities and Exchange Commission’s Release No. 33-10890.
Item 7. Management’s Discussion and Analysis of Financial Condition and Results of Operations
The following discussion and analysis of our financial condition and results of operations for the years ended December 31, 2020, 2021 and 2022 should be read together with our audited consolidated financial statements and related notes included elsewhere in this Annual Report on Form 10‑K. Some of the information contained in this discussion and analysis or set forth elsewhere in this Annual Report on Form 10‑K, including information with respect to our plans and strategies for our business, includes forward‑looking statements that involve risks and uncertainties. You should review the “Risk Factors” section of this Annual Report on Form 10‑K for a discussion of important factors that could cause actual results to differ materially from the results described in, or implied by, the forward‑looking statements contained in this Annual Report on Form 10‑K.
Results of Operations
Operating Segments
The Company conducts business in two segments: Work Truck Attachments and Work Truck Solutions. Under this reporting structure, the Company’s two reportable business segments are as follows:
Work Truck Attachments. The Work Truck Attachments segment includes our operations that manufacture and sell snow and ice control attachments and other products sold under the FISHER®, WESTERN®, and SNOWEX® brands, as well as our vertically integrated products. As described under “Seasonality and Year-To- Year Variability,” the Work Truck Attachments segment is seasonal and, as a result, its results of operations can vary from quarter-to-quarter and from year-to-year.
Work Truck Solutions. The Work Truck Solutions segment includes manufactured municipal snow and ice control products under the HENDERSON® brand and the upfit of market leading attachments and storage solutions under the HENDERSON® brand, and the DEJANA® brand and its related sub-brands.
See Note 17 to the Consolidated Financial Statements for information concerning individual segment performance for the years ended December 31, 2022, December 31, 2021 and December 31, 2020, respectively.
COVID-19 and the Macroeconomic Environment
As a result of the COVID-19 pandemic and its lingering effects, including market volatility, supply chain disruptions, labor shortages, inflationary pressures (including around materials, freight, labor and benefits), and other economic implications associated with the pandemic and the economic and regulatory measures enacted to contain its spread, our results of operations have been impacted in the years ended December 31, 2022, 2021 and 2020, and may be significantly impacted in future years. See below for further discussion of the impact to our financial statements. We are not able to predict the full impact of the pandemic and its lingering effects on our future financial results as the situation remains unpredictable, but the pandemic has had a material impact on our results of operations for the years ended December 31, 2022, 2021 and 2020. In particular, we recorded goodwill impairment charges of $127.9 million in the year ended December 31, 2020 in part as a result of the economic conditions stemming from the pandemic. See Note 2 for additional information.
We may have challenges in short-term liquidity that could impact our ability to fund working capital needs. We have taken various steps to preserve liquidity, including reducing discretionary spending and deferring payments where appropriate within existing contractual terms, while remaining committed to long term growth projects. In addition, as discussed under the section "Liquidity and Capital Resources" below, in January 2023, we expanded the borrowing capacity of our revolving credit facility. In consideration of the COVID-19 pandemic, cash on hand and cash we generated from operations, as well as available credit under our senior credit facilities as amended during 2021, provided adequate and incremental funds throughout 2022, and we expect will continue to provide us with adequate funds in the foreseeable future. We are continuing to take appropriate steps to mitigate the effects of the pandemic where possible. We preventatively and voluntarily closed our facilities on March 18, 2020, suspending production and shipments at all of our locations, which negatively impacted sales volumes and profitability during the shutdown period. Throughout the second quarter of 2020, we slowly ramped up production at various facilities as appropriate and have since returned to full production levels. We have not experienced any additional significant pandemic-related shutdowns since the second quarter of 2020, although we have experienced increased absenteeism as we have encouraged employees to stay home if they experience any symptoms or had exposure to COVID-19. We believe that we have taken all of the necessary and appropriate safety steps and precautions for employees who have returned to work. We will continue to monitor the situation and may take further actions that alter our business operations as may be required by federal, state or local authorities or that we determine are in the best interests of our employees, customers, suppliers and shareholders.
In the year ended December 31, 2021, we determined that facility leases related to two locations in our Work Truck Solutions segment were impaired. These two facilities are being significantly downsized as part of a restructuring plan, and so it was determined that the carrying value exceeded the fair value of the facilities. As a result, we recorded an impairment of $1.2 million in the year ended December 31, 2021 under Impairment charges in the Company’s Consolidated Statements of Income (Loss), offset with a reduction to the Operating lease - right of use asset on our Consolidated Balance Sheets. Going forward, we will amortize the remaining balance of the right of use asset for the impaired leases on a straight line basis. We will continue to amortize the lease liability for the impaired leases over the life of the lease.
Overview
While our Work Truck Solutions operations are not as reliant on snowfall, snowfall is still the primary factor in evaluating our business results due to its significant impact on the results of operations of our Work Truck Attachments segment. We typically compare the snowfall level in a given period both to the snowfall level in the prior season and to those snowfall levels we consider to be average. References to “average snowfall” levels below refer to the aggregate average inches of snowfall recorded in 66 cities in 26 snow‑belt states in the United States during the annual snow season, from October 1 through March 31, from 1980 to 2022. During this period, snowfall averaged 3,012 inches, with the low in such period being 1,794 inches and the high being 4,502 inches. Meanwhile, over the last 10 years, snowfall averaged 3,051 inches for the snow periods ending March 31, 2013 through 2022.
During the six‑month snow season ended March 31, 2022, snowfall was 2,611 inches, which was 13.3% lower than averages from 1980 to 2022. During the six‑month snow season ended March 31, 2021, we experienced snowfall that was 9.4% lower than averages from 1980 to 2021. During the six-month snow season ended March 31, 2020, we experienced snowfall that was 23.2% lower than averages from 1980 to 2020. Snowfall was 14.4% below average during the snow season ended March 31, 2022 when compared to the average over the last 10 years and was the fourth snow season in a row below this average. Snowfall was 7.8% below average during the snow season ended March 31, 2021 when compared to the average over the previous 10 years. Additionally, the timing and location of snowfall can have an impact on our financial results. We believe the below-average snowfall in the year ended December 31, 2022 negatively impacted our business in 2022. We believe other factors also had a negative impact, including the continuing impacts of the COVID-19 pandemic and the resulting supply chain constraints, inflationary pressures and labor shortages. In 2020, 2021 and 2022, we encountered chassis availability issues with certain of our OEM partners, which negatively impacted our business, and which we expect to continue into 2023.
The following table sets forth, for the periods presented, the consolidated statements of income (loss) of the Company and its subsidiaries. All intercompany balances and transactions have been eliminated in consolidation. In the table below and throughout this “Management’s Discussion and Analysis of Financial Condition and Results of Operations,” consolidated statements of income (loss) data for the years ended December 31, 2020, 2021 and 2022 have been derived from our audited consolidated financial statements. The information contained in the table below should be read in conjunction with our consolidated financial statements and the related notes included elsewhere in this Annual Report on Form 10‑K.
| |
|
For the year ended December 31, |
|
| |
|
2020 |
|
|
2021 |
|
|
2022 |
|
| |
|
(in thousands) |
|
| |
|
|
|
|
|
|
|
|
|
|
|
|
| Net sales |
|
$ |
480,154 |
|
|
$ |
541,453 |
|
|
$ |
616,068 |
|
| Cost of sales |
|
|
351,874 |
|
|
|
399,581 |
|
|
|
464,612 |
|
| Gross profit |
|
|
128,280 |
|
|
|
141,872 |
|
|
|
151,456 |
|
| Selling, general, and administrative expense |
|
|
64,617 |
|
|
|
78,844 |
|
|
|
82,183 |
|
| Impairment charges |
|
|
127,872 |
|
|
|
1,211 |
|
|
|
- |
|
| Intangibles amortization |
|
|
10,931 |
|
|
|
10,682 |
|
|
|
10,520 |
|
| Income (loss) from operations |
|
|
(75,140 |
) |
|
|
51,135 |
|
|
|
58,753 |
|
| Interest expense, net |
|
|
(20,238 |
) |
|
|
(11,839 |
) |
|
|
(11,253 |
) |
| Debt modification expense |
|
|
(3,542 |
) |
|
|
- |
|
|
|
- |
|
| Loss on extinguishment of debt |
|
|
- |
|
|
|
(4,936 |
) |
|
|
- |
|
| Other income (expense), net |
|
|
91 |
|
|
|
228 |
|
|
|
(139 |
) |
| Income (loss) before taxes |
|
|
(98,829 |
) |
|
|
34,588 |
|
|
|
47,361 |
|
| Income tax expense (benefit) |
|
|
(12,276 |
) |
|
|
3,897 |
|
|
|
8,752 |
|
| Net income (loss) |
|
$ |
(86,553 |
) |
|
$ |
30,691 |
|
|
$ |
38,609 |
|
The following table sets forth, for the periods indicated, the percentage of certain items in our consolidated statement of income (loss) data, relative to net sales:
| |
|
For the year ended December 31, |
|
| |
|
2020 |
|
|
2021 |
|
|
2022 |
|
| |
|
|
|
|
|
|
|
|
|
|
|
|
| Net sales |
|
|
100.0 |
% |
|
|
100.0 |
% |
|
|
100.0 |
% |
| Cost of sales |
|
|
73.3 |
% |
|
|
73.8 |
% |
|
|
75.4 |
% |
| Gross profit |
|
|
26.7 |
% |
|
|
26.2 |
% |
|
|
24.6 |
% |
| Selling, general, and administrative expense |
|
|
13.5 |
% |
|
|
14.6 |
% |
|
|
13.4 |
% |
| Impairment charges |
|
|
26.6 |
% |
|
|
0.2 |
% |
|
|
0.0 |
% |
| Intangibles amortization |
|
|
2.3 |
% |
|
|
2.0 |
% |
|
|
1.7 |
% |
| Income (loss) from operations |
|
|
(15.6 |
)% |
|
|
9.4 |
% |
|
|
9.5 |
% |
| Interest expense, net |
|
|
(4.2 |
)% |
|
|
(2.2 |
)% |
|
|
(1.8 |
)% |
| Debt modification expense |
|
|
(0.7 |
)% |
|
|
0.0 |
% |
|
|
0.0 |
% |
| Loss on extinguishment of debt |
|
|
0.0 |
% |
|
|
(0.9 |
)% |
|
|
0.0 |
% |
| Other income (expense), net |
|
|
0.0 |
% |
|
|
0.0 |
% |
|
|
(0.0 |
)% |
| Income (loss) before taxes |
|
|
(20.6 |
)% |
|
|
6.3 |
% |
|
|
7.7 |
% |
| Income tax expense (benefit) |
|
|
(2.6 |
)% |
|
|
0.7 |
% |
|
|
1.4 |
% |
| Net income (loss) |
|
|
(18.0 |
)% |
|
|
5.6 |
% |
|
|
6.3 |
% |
Year Ended December 31, 2022 Compared to Year Ended December 31, 2021
Net Sales. Net sales were $616.1 million for the year ended December 31, 2022 compared to $541.5 million in 2021, an increase of $74.6 million, or 13.8%. Net sales increased for the year ended December 31, 2022 primarily due to pricing actions in both segments, as well as strong pre-season order demand in our Work Truck Attachments segment leading to increased volumes. See below for a discussion of net sales for each of our segments.
| |
|
For the year ended December 31, |
|
| |
|
2020 |
|
|
2021 |
|
|
2022 |
|
| Net sales |
|
|
|
|
|
|
|
|
|
|
|
|
| Work Truck Attachments |
|
$ |
252,838 |
|
|
$ |
325,707 |
|
|
$ |
382,296 |
|
| Work Truck Solutions |
|
|
227,316 |
|
|
|
215,746 |
|
|
|
233,772 |
|
| |
|
$ |
480,154 |
|
|
$ |
541,453 |
|
|
$ |
616,068 |
|
Net sales at our Work Truck Attachment segment were $382.3 million for the year ended December 31, 2022 compared to $325.7 million in the year ended December 31, 2021, an increase of $56.6 million primarily due to pricing actions, as well as strong pre-season order demand leading to increased volumes. This increased pre-season order volume was despite snowfall in this most recent snow season ended March 2022 being approximately 14% below the ten-year average, compared to the prior snow season ended March 2021, which was approximately 8% below the ten-year average.
Net sales at our Work Truck Solutions segment were $233.8 million for the year ended December 31, 2022 compared to $215.7 million in the year ended December 31, 2021, an increase of $18.1 million due primarily to price increase realization, somewhat offset by chassis and component shortages leading to lower production and deliveries.
Cost of Sales. Cost of sales was $464.6 million for the year ended December 31, 2022 compared to $399.6 million in 2021, an increase of $65.0 million, or 16.3%. The increase in cost of sales for the year ended December 31, 2022 compared to the prior year was driven by the higher volumes at Work Truck Attachments, as well as material, labor and freight inflation. Cost of sales as a percentage of net sales increased from 73.8% for the year ended December 31, 2021 to 75.4% for the year ended December 31, 2022. The increase in cost of sales as a percentage of sales in the year ended December 31, 2022 when compared to the year ended December 31, 2021 was primarily due to inflation, slightly offset by product mix and cost savings initiatives.
Gross Profit. Gross profit was $151.5 million for the year ended December 31, 2022 compared to $141.9 million in 2021, an increase of $9.6 million, or 6.8%, due to the increase in net sales described above under “—Net Sales.” As a percentage of net sales, gross profit decreased from 26.2% for the year ended December 31, 2021 to 24.6% for the corresponding period in 2022, as a result of the factors discussed above under “—Cost of Sales.”
Selling, General and Administrative Expense. Selling, general and administrative expenses, including intangible asset amortization, were $92.7 million for the year ended December 31, 2022 compared to $89.5 million for the year ended December 31, 2021, an increase of $3.2 million, or 3.6%. The increase compared to the year ended December 31, 2021 was due to increased salaries and benefits, incentive compensation, travel expenditures, advertising costs, as well as other discretionary spending as spending was reduced in 2021 as a result of the COVID-19 pandemic. This increase was somewhat offset by a decrease in bad debt expense. As a percentage of net sales, selling, general and administrative expenses, including intangibles amortization, decreased from 16.5% for the year ended December 31, 2021 to 15.1% for the corresponding period in 2022.
Impairment Charges. Impairment charges were $0.0 million and $1.2 million for the years ended December 31, 2022 and 2021, respectively. The impairment charges in 2021 relate to impairments recorded on leases for two Work Truck Solutions locations where we are significantly reducing our footprint. See Note 7 for additional information.
Interest Expense. Interest expense was $11.3 million for the year ended December 31, 2022 compared to $11.8 million in the corresponding period in 2021. The decrease in interest expense for the year ended December 31, 2022 was primarily due to lower interest paid on our term loan of $2.4 million due to the decrease in principal balance from the June 9, 2021 refinancing. Somewhat offsetting this decrease is an increase in interest expense on our revolving line of credit of $1.6 million in the year ended December 31, 2022 due to having higher revolver borrowings during the year, as well as an increase in the variable interest rate in 2022. Also offsetting this decrease in interest expense was having a ($0.7) million gain in non-cash mark-to-market and amortization adjustments on an interest rate swap not accounted for as a hedge in the year ended December 31, 2022, respectively, compared to a ($1.2) million gain in the year ended December 31, 2021. See Note 9 for additional information.
Loss on Extinguishment of Debt. Loss on extinguishment of debt was $4.9 million in the year ended December 31, 2021. The loss on extinguishment of debt in 2021 related to fees incurred in conjunction with our June 9, 2021 refinancing of the Credit Agreement. The previous debt was considered extinguished, as all lenders on our previous term loan exited their positions in conjunction with changing from a Term Loan B to a Term Loan A arrangement.
Income Tax Expense. Our effective combined federal and state tax rate for 2022 was 18.5% compared to 11.3% for 2021. The effective tax rate for the year ended December 31, 2022 was higher than the rate in the prior year due to a discrete tax benefit of $3.3 million in the year ended December 31, 2021 related to favorable income tax audit results in states in which we file. The effective tax rate for the year ended December 31, 2022 was lower than historical averages related to higher tax credits and state income tax rate changes.
Deferred income taxes reflect the net tax effects of temporary differences between the carrying amounts of assets and liabilities for financial reporting purposes and the amounts used for income tax purposes. The largest item affecting the deferred taxes is the difference between book and tax amortization of goodwill and other intangible amortization.
Net Income. Net income for the year ended December 31, 2022 was $38.6 million compared to net income of $30.7 million for 2021, an increase of $7.9 million. This increase was driven by the factors described above.
Year Ended December 31, 2021 Compared to Year Ended December 31, 2020
Net Sales. Net sales were $541.5 million for the year ended December 31, 2021 compared to $480.2 million in 2020, an increase of $61.3 million, or 12.8%. Net sales increased for the year ended December 31, 2021 primarily due to pricing actions, improved snowfall levels for the snow season ended March 31, 2021 when compared to the prior year, as well as the release of pent-up demand after pandemic-related dealer conservatism in 2020. In addition, sales for year ended December, 2021 were higher when compared to the same period in the prior year due to the effect of reduced shipments in the prior year from our facilities being shut down as a result of the COVID-19 pandemic for several weeks throughout the first and second quarters of 2020. See below for a discussion of net sales for each of our segments.
Net sales at our Work Truck Attachment segment were $325.7 million for the year ended December 31, 2021 compared to $252.8 million in the year ended December 31, 2020, an increase of $72.9 million primarily due to pricing actions, improved snowfall levels, as well as the deferral of sales from 2020 to 2021 due to pandemic-related dealer conservatism in the prior year. Snowfall in this most recent snow season ended March 2021 was approximately 8% below the ten-year average, compared to the prior snow season ended March 2020 which was approximately 25% below the ten-year average
Net sales at our Work Truck Solutions segment were $215.7 million for the year ended December 31, 2021 compared to $227.3 million in the year ended December 31, 2020, a decrease of $11.6 million due primarily to chassis and component shortages leading to lower production and deliveries. This decrease was somewhat offset by an increase related to pricing actions, as well as the effect of lower volumes in the prior year from the facilities shutdown associated with the COVID-19 pandemic leading to significantly reduced shipments in the first and second quarters of 2020.
Cost of Sales. Cost of sales was $399.6 million for the year ended December 31, 2021 compared to $351.9 million in 2020, an increase of $47.7 million, or 13.6%. Cost of sales as a percentage of net sales increased from 73.3% for the year ended December 31, 2020 to 73.8% for the year ended December 31, 2021. The increase in cost of sales as a percentage of sales in the year ended December 31, 2021 when compared to the year ended December 31, 2020 was primarily due to significant materials, freight and labor inflation. This increase was somewhat offset by a decrease related to facility shutdown expenses associated with COVID-19 in the prior year, slightly offset by inflation. Such shutdown expenses include the continuation of wages for employees who were not working during the shutdown, as well as an increase in fixed expenses and overhead, as these costs were not capitalized into inventory for the shutdown period.
Gross Profit. Gross profit was $141.9 million for the year ended December 31, 2021 compared to $128.3 million in 2020, an increase of $13.6 million, or 10.6%, due to the increase in net sales described above under “—Net Sales.” As a percentage of net sales, gross profit decreased from 26.7% for the year ended December 31, 2020 to 26.2% for the corresponding period in 2021, as a result of the factors discussed above under “—Cost of Sales.”
Selling, General and Administrative Expense. Selling, general and administrative expenses, including intangible asset amortization, were $89.5 million for the year ended December 31, 2021 compared to $75.5 million for the year ended December 31, 2020, an increase of $14.0 million, or 18.5%. The increase compared to the year ended December 31, 2020 was in part due to $2.0 million of earnout valuation adjustments in the year ended December 31, 2020. In addition, the increase in the year ended December 31, 2021 is due to increased incentive-based compensation of $6.2 million on the improved operating results. The remaining increases relate to employee salaries and benefits, as well as a return to more normalized discretionary spending after lower spending in 2020. As a percentage of net sales, selling, general and administrative expenses, including intangibles amortization, increased from 15.7% for the year ended December 31, 2020 to 16.5% for the corresponding period in 2021.
Impairment Charges. Impairment charges were $1.2 million and $127.9 million for the years ended December 31, 2021 and 2020, respectively. The impairment charges in 2021 relate to impairments recorded on leases for two Work Truck Solutions locations where we are significantly reducing our footprint. See Note 7 for additional information. The impairment charges in 2020 relate to goodwill impairment taken on our Municipal and Dejana reporting units of $47.8 and $80.1 million, respectively, due to reduced performance in 2020 and projected future years as a result of the COVID-19 pandemic and chassis and other supply chain constraints. See Note 2 for additional information.
Interest Expense. Interest expense was $11.8 million for the year ended December 31, 2021 compared to $20.2 million in the corresponding period in 2020. The decrease in interest expense for the year ended December 31, 2021 was primarily due to lower interest paid on our term loan of $3.7 million due to the decrease in principal balance from the June 9, 2021 refinancing. The decrease in the year ended December 31, 2021 was also due to a ($1.2) million gain in non-cash mark-to-market and amortization adjustments on an interest rate swap not accounted for as a hedge in the year ended December 31, 2021, respectively, compared to a $2.9 million loss in the year ended December 31, 2020. The remaining decrease in interest expense was due to lower interest paid on our floor plan financing agreement. See Note 9 for additional information.
Debt Modification Expense. Debt modification expense was $3.5 million in the year ended December 31, 2020. The debt modification expense in 2020 related to fees incurred in conjunction with the Company’s June 8, 2020 refinancing of its Term Loan and Revolving Credit Agreement.
Loss on Extinguishment of Debt. Loss on extinguishment of debt was $4.9 million in the year ended December 31, 2021. The loss on extinguishment of debt in 2021 related to fees incurred in conjunction with the Company’s June 9, 2021 refinancing of its Credit Agreement. The previous debt was considered extinguished, as all lenders on our previous term loan exited their positions in conjunction with changing from a Term Loan B to a Term Loan A arrangement.
Income Tax Expense. Our effective combined federal and state tax rate for 2021 was 11.3% compared to 12.4% for 2020. The effective tax rate for the year ended December 31, 2021 was lower than the Company’s historical annual effective tax rates due to a discrete tax benefit of $3.3 million related to favorable income tax audit results in states in which we file. The following items caused the effective tax rate for the year ended December 31, 2020 to be significantly lower than the Company’s historical annual effective tax rate:
| |
● |
The Company recorded an impairment of nondeductible goodwill related to the Municipal reporting unit within the Work Truck Solutions segment. This decreased the rate by 10.1% for the year ended December 31, 2020. |
| |
● |
After an evaluation of recent profitability, future projections of profitability, and future deferred tax liabilities, the Company concluded that an additional valuation allowance of approximately $1,670 is necessary for certain state deferred tax assets. This decreased the rate by 1.7% for the year ended December 31, 2020. |
Deferred income taxes reflect the net tax effects of temporary differences between the carrying amounts of assets and liabilities for financial reporting purposes and the amounts used for income tax purposes. The largest item affecting the deferred taxes is the difference between book and tax amortization of goodwill and other intangible amortization.
Net Income (Loss). Net income for the year ended December 31, 2021 was $30.7 million compared to net loss of $86.6 million for 2020, an increase of $117.3 million. This increase was driven by the factors described above.
Discussion of Critical Accounting Policies and Estimates
Our consolidated financial statements are prepared in accordance with GAAP. The preparation of these consolidated financial statements requires us to make estimates and assumptions that affect the reported amounts of assets, liabilities, revenues, costs and expenses, and related disclosures. These estimates and assumptions are often based on judgments that we believe to be reasonable under the circumstances at the time made, but all such estimates and assumptions are inherently uncertain and unpredictable. Actual results may differ from those estimates and assumptions, and it is possible that other professionals, applying their own judgment to the same facts and circumstances, could develop and support alternative estimates and assumptions that would result in material changes to our operating results and financial condition. We evaluate our estimates and assumptions on an ongoing basis. Our estimates are based on historical experience and various other assumptions that we believe to be reasonable under the circumstances.
The most significant accounting estimates inherent in the preparation of our financial statements include estimates used in revenue recognition and the impairment assessment of indefinite lived intangible assets and goodwill.
We believe the following are the critical accounting policies and estimates that affect our financial condition and results of operations.
Revenue Recognition
In May 2014, the FASB issued Accounting Standards Update (“ASU”) No. 2014-09, Revenue from Contracts with Customers (Topic 606), which supersedes the revenue recognition requirements in ASC 605, Revenue Recognition. We adopted ASC 606 using the modified retrospective method as of January 1, 2018. This approach was applied to all contracts not completed as of the date of initial application. Upon adoption, we recognized the cumulative effect of adopting this guidance as an adjustment to the opening balance of retained earnings of $0.4 million.
Work Truck Attachments Segment Revenue Recognition
We recognize revenue upon shipment of equipment to the customer. Within the Work Truck Attachments segment, we offer a variety of discounts and sales incentives to our distributors. The estimated liability for sales discounts and allowances is recorded at the time of sale as a reduction of net sales using the expected value method. The liability is estimated based on the costs of the program, the planned duration of the program and historical experience.
Work Truck Solutions Segment Revenue Recognition
The Work Truck Solutions segment primarily participates in the truck and vehicle upfitting industry in the United States. Customers are billed separately for the truck chassis by the chassis manufacturer. We only record sales for the amount of the upfit, excluding the truck chassis. Generally, we obtain the truck chassis from the truck chassis manufacturer through either our floor plan agreement with a financial institution or bailment pool agreement with the truck chassis manufacturer. Additionally, in some instances we upfit chassis which are owned by the end customer. For truck chassis acquired through the floor plan agreement, we hold title to the vehicle from the time the chassis is received by us until the completion of the up-fit. Under the bailment pool agreement, we do not take title to the truck chassis, but rather only hold the truck chassis on consignment. We pay interest on both of these arrangements. We record revenue in the same manner net of the value of the truck chassis in both our floor plan and bailment pool agreements. We do not set the price for the truck chassis, are not responsible for the billing of the chassis and do not have inventory risk in either the bailment pool or floor plan agreements. The Work Truck Solutions segment also has manufacturing operations of municipal snow and ice control equipment, where revenue is recognized upon shipment of equipment to the customer.
Revenues from the sales of the Work Truck Solutions products are recognized net of the truck chassis with the selling price to the customer recorded as sales and the manufacturing and up-fit cost of the product recorded as cost of sales. In these cases, we act as an agent as we do not have inventory or pricing control over the truck chassis. Within the Work Truck Solutions segment, we also sell certain third-party products for which we act as an agent. These sales do not meet the criteria for gross sales recognition, and thus are recognized on a net basis at the time of sale. Under net sales recognition, the cost paid to the third-party service provider is recorded as a reduction to sales, resulting in net sales being equal to the gross profit on the transaction.
See Note 3 to our audited consolidated financial statements included elsewhere in this Annual Report on Form 10‑K for a more detailed description of our revenue recognition policies.
Indefinite Lived Intangible Assets
We perform an annual impairment test for our indefinite lived intangible assets, and more frequently if an event or circumstances indicate that an impairment loss has been incurred. We carry tradenames associated with our reporting units. Conditions that would trigger an impairment assessment include, but are not limited to, a significant adverse change in legal factors or business climate that could affect the value of an asset. The amount of impairment is determined by the amount the carrying value of the intangible asset exceeds its fair value. If the fair value of the tradename is greater than the carrying amount, there is no impairment. If the carrying amount is greater than the fair value, an impairment loss is recognized equal to the difference. Annual impairment tests conducted by us on December 31, 2022, 2021 and 2020 resulted in no adjustment to the carrying value of our indefinite lived intangible assets.
Our indefinite lived intangible assets could be impaired in future periods. A number of factors, many of which we have no ability to control, could affect our financial condition, operating results and business prospects and could cause actual results to differ from the estimates and assumptions we employed. These factors include:
| |
● |
a prolonged global economic crisis; |
| |
● |
significant inflation or disruptions in the supply of chassis or component parts, as a result from computer chip shortages or otherwise; |
| |
● |
a decrease in the demand for our products; |
| |
● |
the inability to develop new and enhanced products and services in a timely manner; |
| |
● |
a significant adverse change in legal factors or in the business climate; |
| |
● |
an adverse action or assessment by a regulator; and |
| |
● |
successful efforts by our competitors to gain market share in our markets. |
At December 31, 2022, our Dejana reporting unit had tradenames of $14.0 million and an estimated fair value of $17.1 million. If we are unable to attain the financial projections used in calculating the fair value, or if there are significant market conditions impacting the market approach, including the factors noted above, our Dejana tradenames could be at risk of impairment. If we experience further delays by our supplier and OEM partners in the production and delivery of chassis for a prolonged period of time, which could negatively affect our financial results, the Dejana tradenames may be impaired. The discount rate and royalty rate used in the calculation of the fair value are sensitive and based on our assumptions, and changes to those assumptions could cause the Dejana tradenames to be at risk of impairment. There were no indicators of impairment subsequent to the December 31, 2022 impairment test.
Goodwill
We perform an annual impairment test for goodwill and more frequently if an event or circumstances indicate that an impairment loss has been incurred. Conditions that would trigger an impairment assessment include, but are not limited to, a significant adverse change in legal factors or business climate that could affect the value of an asset. The amount of goodwill impairment is determined by the amount the carrying value of the reporting unit exceeds its fair value. We have determined we have four reporting units, and all significant decisions are made on a company-wide basis by our chief operating decision maker. The fair value of the reporting unit is estimated by using an income and market approach. The estimated fair value is compared with our aggregate carrying value. If our fair value is greater than the carrying amount, there is no impairment. If our carrying amount is greater than the fair value, an impairment loss is recognized equal to the difference. Annual impairment tests conducted by us on December 31, 2022 and 2021 resulted in no adjustment to the carrying value of our goodwill. During the second quarter of 2020, the Company identified a triggering event as there had been a significant decline in the business climate and in results of operations as a result of uncertainty related to the COVID-19 pandemic and chassis availability. Given these indicators, the Company determined that there was a higher degree of uncertainty in achieving its financial projections. Therefore, the Company performed an impairment test as of June 30, 2020 for each of its reporting units, and subsequently performed its annual impairment testing as of December 31, 2020.
The Work Truck Attachments segment consists of two reporting units: Commercial Snow & Ice and Douglas Dynamics Vertical Integration. Only the Commercial Snow & Ice reporting unit has goodwill. The impairment tests performed as of June 30, 2020, December 31, 2020, December 31, 2021 and December 31, 2022 indicated no impairment for the Commercial Snow & Ice reporting unit. The Work Truck Solutions consists of two reporting units; Municipal and Dejana. At June 30, 2020, the Municipal reporting unit’s carrying value exceeded its fair value. As a result, all $47,799 of the Municipal goodwill balance was recorded as an impairment charge during year ended December 31, 2020 and is included in Impairment charges on the Consolidated Statements of Income (Loss). At June 30, 2020, the Dejana reporting unit’s carrying value exceeded its fair value. As a result, all $80,073 of the Dejana goodwill balance was recorded as an impairment charge during the year ended December 31, 2020 and is included in Impairment charges on the Consolidated Statements of Income (Loss).
Liquidity and Capital Resources
Our principal sources of cash have been and we expect will continue to be cash from operations and borrowings under our senior credit facilities.
Our primary uses of cash are to provide working capital, meet debt service requirements, finance capital expenditures, pay dividends under our dividend policy and support our growth, including through potential acquisitions, and for other general corporate purposes. For a description of the seasonality of our working capital rates see “—Seasonality and Year‑To‑Year Variability.”
Our Board of Directors has adopted a dividend policy that reflects an intention to distribute to our stockholders a regular quarterly cash dividend. The declaration and payment of these dividends to holders of our common stock is at the discretion of our Board of Directors and depends upon many factors, including our financial condition and earnings, legal requirements, taxes and other factors our Board of Directors may deem to be relevant. The terms of our indebtedness may also restrict us from paying cash dividends on our common stock under certain circumstances. As a result of this dividend policy, we may not have significant cash available to meet any large unanticipated liquidity requirements. As a result, we may not retain a sufficient amount of cash to fund our operations or to finance unanticipated capital expenditures or growth opportunities, including acquisitions. Our Board of Directors may, however, amend, revoke or suspend our dividend policy at any time and for any reason.
On February 16, 2022, the Company’s Board of Directors authorized the purchase of up to $50.0 million in shares of common stock at market value. This authorization does not have an expiration date. Repurchases under the program may be made in the open market, in privately negotiated transactions or otherwise, with the amount and timing of repurchases depending on market conditions and corporate needs. The Company may also, from time to time, enter into Rule 10b5-1 trading plans to facilitate repurchases of its shares under this authorization. This program does not obligate the Company to acquire any particular amount of shares and the program may be extended, modified, suspended or discontinued at any time at the Company’s discretion. The Company made $6.0 million in share repurchases during the year ended December 31, 2022.
As of December 31, 2022, we had liquidity comprised of approximately $20.7 million in cash and cash equivalents and borrowing availability of approximately $99.5 million under our revolving credit facility, though our borrowing capacity was increased following our fiscal year end as described below. We have taken various steps to preserve liquidity, including reducing discretionary spending and deferring payments where appropriate within existing contractual terms, while remaining committed to long-term growth projects. In consideration of the COVID-19 pandemic and other macroeconomic factors facing the Company, we expect that cash on hand, cash generated from operations, as well as available credit under our senior credit facilities will provide adequate funds for the purposes described above for both 12 months from the date of this report, as well as beyond 12 months from the date of this report.
On June 9, 2021, Douglas Dynamics, Inc. (the “Company”), as guarantor, and its wholly-owned subsidiaries, Douglas Dynamics, L.L.C. (“DDI LLC” or the “Term Loan Borrower”), Fisher, LLC (“Fisher”), Trynex International LLC (“Trynex”), Henderson Enterprises Group, Inc. (“Enterprises”), Henderson Products, Inc. (“Products”), and Dejana Truck & Utility Equipment Company, LLC (“Dejana”, together with DDI LLC, Fisher, Trynex, Enterprises and Products, the “Revolving Loan Borrowers”, and together with DDI LLC in its capacity as the Term Loan Borrower, the “Borrowers”), as borrowers, entered into a Credit Agreement (following such time as it was amended by the Amendment No. 1 (as defined below), the “Credit Agreement”) with the banks and financial institutions listed in the Credit Agreement, as lenders, JPMorgan Chase Bank, N.A., as administrative agent, J.P. Morgan Chase Bank, N.A. and CIBC Bank USA, as joint lead arrangers and joint bookrunners, CIBC Bank USA, as syndication agent, and Bank of America, N.A. and Citizens Bank, N.A., as co-documentation agents.
The Credit Agreement provides for a senior secured term loan to the Term Loan Borrower in the amount of $225.0 million and a senior secured revolving credit facility available to the Revolving Loan Borrowers in the amount of $100.0 million, of which $10.0 million will be available in the form of letters of credit and $15.0 million will be available for the issuance of short-term swingline loans. The Credit Agreement also allows the Revolving Loan Borrowers to request increases to the revolving commitments and/or incremental term loans in an aggregate amount not in excess of $175.0 million (the “Revolving Commitment Increase Option”), subject to specified terms and conditions. The final maturity date of the Credit Agreement is June 9, 2026.
On January 5, 2023, the Company entered into that certain Amendment No. 1 to Credit Agreement and Revolving Credit Commitment Increase Supplement (“Amendment No. 1”) by and among the Company, the Borrowers, the financial institutions listed in Amendment No. 1 as lenders, and JPMorgan Chase Bank, N.A., as administrative agent, which amended the Credit Agreement and pursuant to which, among other things, (i) the Revolving Loan Borrowers exercised a portion of the Revolving Commitment Increase Option and increased the revolving commitment under the Credit Agreement by $50.0 million for a total of $150.0 million in the aggregate and (ii) the London Interbank Offered Rate pricing option under the Credit Agreement was replaced with a Term SOFR Rate pricing option.
Pursuant to Amendment No. 1, the Credit Agreement provides that the senior secured term loan facility will bear interest at (i) the Term SOFR Rate for the applicable interest period plus (ii) a margin ranging from 1.375% to 2.00%, depending on DDI LLC’s Leverage Ratio. The Credit Agreement provides that the Revolving Loan Borrowers have the option to select whether the senior secured revolving credit facility borrowings will bear interest at either (i)(a) the Term SOFR Rate for the applicable interest period plus (b) 0.10% plus (c) a margin ranging from 1.375% to 2.00%, depending on DDI LLC’s Leverage Ratio, or (ii) a margin ranging from 0.375% to 1.00% per annum, depending on DDI LLC’s Leverage Ratio, plus the greatest of (which if the following would be less than 1.00%, such rate shall be deemed to be 1.00%) (a) the Prime Rate (as defined in the Credit Agreement) in effect on such day, (b) the NYFRB Rate (as defined in the Credit Agreement) plus 0.50% and (c) the Term SOFR Rate for a one month interest plus 0.10% (the “Adjusted Term SOFR Rate”). If the Adjusted Term SOFR Rate for the applicable interest period is less than zero, such rate shall be deemed to be zero for purposes of calculating the foregoing interest rates in the Credit Agreement.
Cash Flow Analysis
Set forth below is summary cash flow information for each of the years ended December 31, 2020, 2021 and 2022.
| |
|
Year ended December 31, |
|
| Cash Flows (in thousands) |
|
2020 |
|
|
2021 |
|
|
2022 |
|
| Net cash provided by operating activities |
|
$ |
53,366 |
|
|
$ |
60,535 |
|
|
$ |
40,030 |
|
| Net cash used in investing activities |
|
|
(14,490 |
) |
|
|
(11,208 |
) |
|
|
(12,047 |
) |
| Net cash used in financing activities |
|
|
(33,511 |
) |
|
|
(53,393 |
) |
|
|
(44,277 |
) |
| |
|
|
|
|
|
|
|
|
|
|
|
|
| Increase (Decrease) in cash |
|
$ |
5,365 |
|
|
$ |
(4,066 |
) |
|
$ |
(16,294 |
) |
Sources and Uses of Cash
During the three‑year periods described above, net cash provided by operating activities was used for funding capital investment, paying dividends, paying interest on our senior credit facilities, and funding working capital requirements during our pre‑season shipping period.
The following table shows our cash and cash equivalents and inventories at December 31, 2020, 2021 and 2022.
| |
|
December 31, |
|
| |
|
2020 |
|
|
2021 |
|
|
2022 |
|
| |
|
(in thousands) |
|
| Cash and cash equivalents |
|
$ |
41,030 |
|
|
$ |
36,964 |
|
|
$ |
20,670 |
|
| Inventories |
|
|
79,482 |
|
|
|
104,019 |
|
|
|
136,501 |
|
Year Ended December 31, 2022 Compared to Year Ended December 31, 2021
We had cash and cash equivalents of $20.7 million at December 31, 2022 compared to cash and cash equivalents of $37.0 million at December 31, 2021. The table below sets forth a summary of the significant sources and uses of cash for the periods presented.
| |
|
Year ended December 31, |
|
| Cash Flows (in thousands) |
|
2021 |
|
|
2022 |
|
|
Change |
|
| Net cash provided by operating activities |
|
$ |
60,535 |
|
|
$ |
40,030 |
|
|
$ |
(20,505 |
) |
|
|
(33.9 |
%) |
| Net cash used in investing activities |
|
|
(11,208 |
) |
|
|
(12,047 |
) |
|
|
(839 |
) |
|
|
(7.5 |
%) |
| Net cash used in financing activities |
|
|
(53,393 |
) |
|
|
(44,277 |
) |
|
|
9,116 |
|
|
|
17.1 |
% |
| |
|
|
|
|
|
|
|
|
|
|
|
|
|
|
|
|
| Increase (Decrease) in cash |
|
$ |
(4,066 |
) |
|
$ |
(16,294 |
) |
|
$ |
(12,228 |
) |
|
|
(300.7 |
%) |
Net cash provided by operating activities decreased $20.5 million from the year ended December 31, 2021 to the year ended December 31, 2022. The decrease in cash provided by operating activities was due to a $3.4 million decrease in net income adjusted for reconciling items in the year ended December 31, 2022 and $17.1 million in unfavorable working capital changes. The largest drivers negatively impacting working capital were an increase in accounts receivable attributable to the increase in sales compared to the prior year, as well as an increase in inventory due to the pulling forward of purchases in anticipation of inflationary price increases and supply chain disruptions, as well as higher material costs due to inflation, somewhat offset by an increase in accounts payable due to the timing of payments.
Net cash used in investing activities increased $0.8 million for the year ended December 31, 2022, compared to the corresponding period in 2021 due to an increase in capital expenditures.
Net cash used in financing activities decreased $9.1 million for the year ended December 31, 2022 as compared to the corresponding period in 2021. The decrease was primarily a result of making a voluntary $20.0 million prepayment on our debt in the year ended December 31, 2021 and no corresponding payment in 2022. We had no outstanding borrowings under our revolving credit facility at either December 31, 2022 or December 31, 2021. See Note 9 for additional information. Somewhat offsetting this decrease in cash used in financing activities is an increase related to $6.0 million in stock repurchases executed in the year ended December 31, 2022 and no repurchases in the prior year.
Year Ended December 31, 2021 Compared to Year Ended December 31, 2020
We had cash and cash equivalents of $37.0 million at December 31, 2021 compared to cash and cash equivalents of $41.0 million at December 31, 2020. The table below sets forth a summary of the significant sources and uses of cash for the periods presented.
| |
|
Year ended December 31, |
|
| Cash Flows (in thousands) |
|
2020 |
|
|
2021 |
|
|
Change |
|
| Net cash provided by operating activities |
|
$ |
53,366 |
|
|
$ |
60,535 |
|
|
$ |
7,169 |
|
|
|
13.4 |
% |
| Net cash used in investing activities |
|
|
(14,490 |
) |
|
|
(11,208 |
) |
|
|
3,282 |
|
|
|
22.7 |
% |
| Net cash used in financing activities |
|
|
(33,511 |
) |
|
|
(53,393 |
) |
|
|
(19,882 |
) |
|
|
(59.3 |
%) |
| |
|
|
|
|
|
|
|
|
|
|
|
|
|
|
|
|
| Increase (Decrease) in cash |
|
$ |
5,365 |
|
|
$ |
(4,066 |
) |
|
$ |
(9,431 |
) |
|
|
175.8 |
% |
Net cash provided by operating activities increased $7.2 million from the year ended December 31, 2020 to the year ended December 31, 2021. The increase in cash provided by operating activities was due to a $13.9 million increase in net income (loss) adjusted for reconciling items as a result of the higher net income in the year ended December 31, 2021 and $6.7 million in unfavorable working capital changes. The largest driver negatively impacting working capital was an increase in inventories due to inflationary increases in the cost of inventory, as well as carrying elevated levels of inventory in anticipation of supply chain disruptions. Somewhat offsetting this negative impact on working capital was a favorable increase in accounts payable driven by the increase in inventory, and a favorable decrease in accounts receivable on strong collections.
Net cash used in investing activities decreased $3.3 million for the year ended December 31, 2021, compared to the corresponding period in 2020 due to a decrease in capital expenditures.
Net cash used in financing activities increased $19.9 million for the year ended December 31, 2021 as compared to the corresponding period in 2020. The increase was primarily a result of our debt refinancing that occurred on June 9, 2021 where we borrowed $225.0 million, compared to our debt refinancing on June 8, 2020, where we borrowed $275.0 million. We had no outstanding borrowings under our revolving credit facility at either December 31, 2021 or December 31, 2020. See Note 9 for additional information.
Non‑GAAP Financial Measures
This Annual Report on Form 10‑K contains financial information calculated other than in accordance with U.S. generally accepted accounting principles (“GAAP”).
These non‑GAAP measures include:
| |
● |
Adjusted net income (loss) and earnings per share. |
These non‑GAAP disclosures should not be construed as an alternative to the reported results determined in accordance with GAAP.
Net cash provided by operating activities was $40.0 million in the year ended December 31, 2022 as compared to $60.5 million in the year ended December 31, 2021. Free cash flow (as defined below) for the year ended December 31, 2022 was $28.0 million compared to $49.3 million in 2021, a decrease in free cash flow of $21.3 million, or 43.2%. The decrease in free cash flow is primarily a result of a decrease in cash provided by operating activities of $20.5 million and an increase in capital expenditures of $0.8 million, as discussed above under “Liquidity and Capital Resources.” Free cash flow for the year ended December 31, 2021 was $49.3 million compared to $38.9 million in 2020, an increase in free cash flow of $10.4 million, or 26.7%. The increase in free cash flow is primarily a result of an increase in cash provided by operating activities of $7.2 million and a decrease in capital expenditures of $3.3 million.
Free cash flow is a non‑GAAP financial measure, which we define as net cash provided by operating activities less capital expenditures. Free cash flow should be evaluated in addition to, and not considered a substitute for, other financial measures such as net income and cash flow provided by operations. We believe that free cash flow provides investors with a useful tool to evaluate our ability to generate additional cash flow from our business operations.
The following table reconciles net cash provided by operating activities, a GAAP measure, to free cash flow, a non‑GAAP measure.
| |
|
For the year ended December 31, |
|
| |
|
2020 |
|
|
2021 |
|
|
2022 |
|
| |
|
(in thousands) |
|
| Net cash provided by operating activities |
|
$ |
53,366 |
|
|
$ |
60,535 |
|
|
$ |
40,030 |
|
| Acquisition of property and equipment |
|
|
(14,490 |
) |
|
|
(11,208 |
) |
|
|
(12,047 |
) |
| Free cash flow |
|
$ |
38,876 |
|
|
$ |
49,327 |
|
|
$ |
27,983 |
|
Adjusted EBITDA represents net income (loss) before interest, taxes, depreciation and amortization, as further adjusted for certain charges consisting of unrelated legal and consulting fees, pension termination costs, stock based compensation, severance, restructuring charges, loss on disposal of fixed assets related to facility relocations, litigation proceeds, certain non-cash purchase accounting expenses, impairment charges, expenses related to debt modifications, loss on extinguishment of debt, and incremental costs related to the COVID-19 pandemic. Such COVID-19 related costs include increased expenses directly related to the pandemic, and do not include either production related overhead inefficiencies or lost or deferred sales. We believe these costs are out of the ordinary, unrelated to our business and not representative of our results. We use, and we believe our investors benefit from the presentation of Adjusted EBITDA in evaluating our operating performance because it provides us and our investors with additional tools to compare our operating performance on a consistent basis by removing the impact of certain items that management believes do not directly reflect our core operations. In addition, we believe that Adjusted EBITDA is useful to investors and other external users of our consolidated financial statements in evaluating our operating performance as compared to that of other companies, because it allows them to measure a company’s operating performance without regard to items such as interest expense, taxes, depreciation and amortization, which can vary substantially from company to company depending upon accounting methods and book value of assets and liabilities, capital structure and the method by which assets were acquired. Our management also uses Adjusted EBITDA for planning purposes, including the preparation of our annual operating budget and financial projections. Management also uses Adjusted EBITDA to evaluate our ability to make certain payments, including dividends, in compliance with our senior credit facilities, which is determined based on a calculation of “Consolidated Adjusted EBITDA” that is substantially similar to Adjusted EBITDA.
Adjusted EBITDA has limitations as an analytical tool. As a result, you should not consider it in isolation, or as a substitute for net income, operating income, cash flow from operating activities or any other measure of financial performance or liquidity presented in accordance with GAAP. Some of these limitations are:
| |
● |
Adjusted EBITDA does not reflect our cash expenditures or future requirements for capital expenditures or contractual commitments; |
| |
● |
Adjusted EBITDA does not reflect changes in, or cash requirements for, our working capital needs; |
| |
● |
Adjusted EBITDA does not reflect the interest expense, or the cash requirements necessary to service interest or principal payments, on our indebtedness; |
| |
● |
Although depreciation and amortization are non‑cash charges, the assets being depreciated and amortized will often have to be replaced in the future, and Adjusted EBITDA does not reflect any cash requirements for such replacements; |
| |
● |
Other companies, including other companies in our industry, may calculate Adjusted EBITDA differently than we do, limiting its usefulness as a comparative measure; and |
| |
● |
Adjusted EBITDA does not reflect tax obligations whether current or deferred. |
Adjusted EBITDA for the year ended December 31, 2022 was $86.8 million compared to $79.5 million in 2021, an increase of $7.3 million, or 9.2%. Adjusted EBITDA for the year ended December 31, 2021 was $79.5 million compared to $74.9 million in 2020, an increase of $4.6 million, or 6.1%. In addition to the specific changes resulting from the adjustments, the changes to Adjusted EBITDA for the periods discussed resulted from factors discussed above under “—Results of Operations.”
The following table presents a reconciliation of net income (loss), the most comparable GAAP financial measure, to Adjusted EBITDA, for each of the periods indicated.
| |
|
For the year ended December 31, |
|
| |
|
2018 |
|
|
2019 |
|
|
2020 |
|
|
2021 |
|
|
2022 |
|
| |
|
(in thousands) |
|
| Net income (loss) |
|
$ |
43,905 |
|
|
$ |
49,166 |
|
|
$ |
(86,553 |
) |
|
$ |
30,691 |
|
|
$ |
38,609 |
|
| |
|
|
|
|
|
|
|
|
|
|
|
|
|
|
|
|
|
|
|
|
| Interest expense—net |
|
|
16,943 |
|
|
|
16,782 |
|
|
|
20,238 |
|
|
|
11,839 |
|
|
|
11,253 |
|
| Income tax expense (benefit) |
|
|
11,854 |
|
|
|
13,451 |
|
|
|
(12,276 |
) |
|
|
3,897 |
|
|
|
8,752 |
|
| Depreciation expense |
|
|
7,613 |
|
|
|
8,256 |
|
|
|
8,806 |
|
|
|
9,634 |
|
|
|
10,418 |
|
| Amortization |
|
|
11,472 |
|
|
|
10,956 |
|
|
|
10,931 |
|
|
|
10,682 |
|
|
|
10,520 |
|
| EBITDA |
|
|
91,787 |
|
|
|
98,611 |
|
|
|
(58,854 |
) |
|
|
66,743 |
|
|
|
79,552 |
|
| Purchase accounting (1) |
|
|
(900 |
) |
|
|
(417 |
) |
|
|
(2,017 |
) |
|
|
- |
|
|
|
- |
|
| Stock based compensation |
|
|
4,550 |
|
|
|
3,239 |
|
|
|
2,830 |
|
|
|
5,794 |
|
|
|
6,730 |
|
| Impairment charges |
|
|
- |
|
|
|
- |
|
|
|
127,872 |
|
|
|
1,211 |
|
|
|
- |
|
| Debt modification expense |
|
|
- |
|
|
|
- |
|
|
|
3,542 |
|
|
|
- |
|
|
|
- |
|
| Loss on extinguishment of debt |
|
|
- |
|
|
|
- |
|
|
|
- |
|
|
|
4,936 |
|
|
|
- |
|
| Litigation proceeds |
|
|
- |
|
|
|
(200 |
) |
|
|
- |
|
|
|
- |
|
|
|
- |
|
| Pension termination |
|
|
- |
|
|
|
6,609 |
|
|
|
- |
|
|
|
- |
|
|
|
- |
|
| COVID-19 (2) |
|
|
- |
|
|
|
- |
|
|
|
1,391 |
|
|
|
82 |
|
|
|
48 |
|
| Other charges (3) |
|
|
1,006 |
|
|
|
263 |
|
|
|
128 |
|
|
|
770 |
|
|
|
450 |
|
| Adjusted EBITDA |
|
$ |
96,443 |
|
|
$ |
108,105 |
|
|
$ |
74,892 |
|
|
$ |
79,536 |
|
|
$ |
86,780 |
|
| (1) |
Reflects $900 in reversal of earnout compensation related to Dejana in the year ended December 31, 2018. Reflects $217 in reversal of earnout compensation related to Henderson, and $200 in reversal of earnout compensation related to Dejana, in the year ended December 31, 2019. Reflects $17 in reversal of earnout compensation related to Henderson, and $2,000 in reversal of earnout compensation related to Dejana, in the year ended December 31, 2020. |
| (2) |
Reflects incremental costs incurred related to the COVID-19 pandemic for the periods presented. Such COVID-19 related costs include increased expenses directly related to the pandemic, and do not include either production related overhead inefficiencies or lost or deferred sales. |
| (3) |
Reflects expenses and accrual reversals for one time, unrelated legal, and consulting fees, severance, restructuring charges, and loss on disposal of fixed assets related to facility relocation for the periods presented. |
The following table presents Adjusted EBITDA by segment for the years ended December 31, 2021 and 2022.
| |
|
For the year ended December 31, |
|
| |
|
2021 |
|
|
2022 |
|
| Adjusted EBITDA |
|
|
|
|
|
|
|
|
| Work Truck Attachments |
|
$ |
77,369 |
|
|
$ |
78,211 |
|
| Work Truck Solutions |
|
|
2,167 |
|
|
|
8,569 |
|
| |
|
$ |
79,536 |
|
|
$ |
86,780 |
|
Adjusted EBITDA at our Work Truck Attachment segment were $78.2 million for the year ended December 31, 2022 compared to $77.4 million in the year ended December 31, 2021, an increase of $0.8 million primarily due to pricing actions and an increase in volumes related to strong pre-season order demand, somewhat offset by material, labor and freight inflation.
Adjusted EBITDA at our Work Truck Solutions segment were $8.6 million for the year ended December 31, 2022 compared to $2.2 million in the year ended December 31, 2021, an increase of $6.4 million due to price increase realization, favorable sales mix, and cost savings initiatives, somewhat offset by inflationary pressures.
Adjusted Net Income (Loss) and Adjusted Earnings Per Share (calculated on a diluted basis) represents net income (loss) and earnings (loss) per share (as defined by GAAP), excluding the impact of stock based compensation, pension termination costs, severance, restructuring charges, loss on disposal of fixed assets related to facility relocations litigation proceeds, non-cash purchase accounting adjustments, tax reform, certain charges related to unrelated legal fees and consulting fees, expenses related to debt modifications, loss on extinguishment of debt, incremental costs incurred related to the COVID-19 pandemic, and adjustments on derivatives not classified as hedges, net of their income tax impact. Such COVID-19 related costs include increased expenses directly related to the pandemic, and do not include either production related overhead inefficiencies or lost or deferred sales. We believe these costs are out of the ordinary, unrelated to our business and not representative of our results. Adjustments on derivatives not classified as hedges are non-cash and are related to overall financial market conditions; therefore, management believes such costs are unrelated to our business and are not representative of our results. Management believes that Adjusted Net Income (Loss) and Adjusted Earnings Per Share are useful in assessing our financial performance by eliminating expenses and income that are not reflective of the underlying business performance. We believe that the presentation of Adjusted Net Income (Loss) for the periods presented allows investors to make meaningful comparisons of our operating performance between periods and to view our business from the same perspective as our management. Because the excluded items are not predictable or consistent, management does not consider them when evaluating our performance or when making decisions regarding allocation of resources.
| |
|
For the year ended December 31, |
|
| |
|
2018 |
|
|
2019 |
|
|
2020 |
|
|
2021 |
|
|
2022 |
|
| |
|
(in thousands, except per share amounts) |
|
| Net income (loss) (GAAP) |
|
$ |
43,905 |
|
|
$ |
49,166 |
|
|
$ |
(86,553 |
) |
|
$ |
30,691 |
|
|
$ |
38,609 |
|
| Adjustments: |
|
|
|
|
|
|
|
|
|
|
|
|
|
|
|
|
|
|
|
|
| - Purchase accounting (1) |
|
|
(900 |
) |
|
|
(417 |
) |
|
|
(2,017 |
) |
|
|
- |
|
|
|
- |
|
| - Stock based compensation |
|
|
4,550 |
|
|
|
3,239 |
|
|
|
2,830 |
|
|
|
5,794 |
|
|
|
6,730 |
|
| - Impairment charges |
|
|
- |
|
|
|
- |
|
|
|
127,872 |
|
|
|
1,211 |
|
|
|
- |
|
| - Debt modification expense |
|
|
- |
|
|
|
- |
|
|
|
3,542 |
|
|
|
- |
|
|
|
- |
|
| - Loss on extinguishment of debt |
|
|
- |
|
|
|
- |
|
|
|
- |
|
|
|
4,936 |
|
|
|
- |
|
| - Litigation proceeds |
|
|
- |
|
|
|
(200 |
) |
|
|
- |
|
|
|
- |
|
|
|
- |
|
| - Pension termination |
|
|
- |
|
|
|
6,609 |
|
|
|
- |
|
|
|
- |
|
|
|
- |
|
| - COVID-19 (2) |
|
|
- |
|
|
|
- |
|
|
|
1,391 |
|
|
|
82 |
|
|
|
48 |
|
| - Adjustments on derivative not classified as hedge (3) |
|
|
- |
|
|
|
- |
|
|
|
2,854 |
|
|
|
(1,192 |
) |
|
|
(688 |
) |
| - Other charges (4) |
|
|
1,006 |
|
|
|
263 |
|
|
|
128 |
|
|
|
770 |
|
|
|
450 |
|
| Tax effect on adjustments |
|
|
(1,164 |
) |
|
|
(2,373 |
) |
|
|
(22,200 |
) |
|
|
(2,900 |
) |
|
|
(1,635 |
) |
| |
|
|
|
|
|
|
|
|
|
|
|
|
|
|
|
|
|
|
|
|
| Adjusted net income (non-GAAP) |
|
$ |
47,397 |
|
|
$ |
56,287 |
|
|
$ |
27,847 |
|
|
$ |
39,392 |
|
|
$ |
43,514 |
|
| |
|
|
|
|
|
|
|
|
|
|
|
|
|
|
|
|
|
|
|
|
| Weighted average common shares outstanding assuming dilution |
|
|
22,704,856 |
|
|
|
22,813,711 |
|
|
|
22,872,032 |
|
|
|
22,964,732 |
|
|
|
22,916,824 |
|
| |
|
|
|
|
|
|
|
|
|
|
|
|
|
|
|
|
|
|
|
|
| Adjusted earnings per common share - dilutive (non-GAAP) |
|
$ |
2.04 |
|
|
$ |
2.42 |
|
|
$ |
1.18 |
|
|
$ |
1.67 |
|
|
$ |
1.84 |
|
| |
|
|
|
|
|
|
|
|
|
|
|
|
|
|
|
|
|
|
|
|
| GAAP diluted earnings (loss) per share |
|
$ |
1.89 |
|
|
$ |
2.11 |
|
|
$ |
(3.81 |
) |
|
$ |
1.29 |
|
|
$ |
1.63 |
|
| Adjustments net of income taxes: |
|
|
|
|
|
|
|
|
|
|
|
|
|
|
|
|
|
|
|
|
| - Purchase accounting (1) |
|
|
(0.03 |
) |
|
|
(0.02 |
) |
|
|
(0.07 |
) |
|
|
- |
|
|
|
- |
|
| - Stock based compensation |
|
|
0.15 |
|
|
|
0.11 |
|
|
|
0.09 |
|
|
|
0.20 |
|
|
|
0.21 |
|
| - Impairment charges |
|
|
- |
|
|
|
- |
|
|
|
4.72 |
|
|
|
0.04 |
|
|
|
- |
|
| - Debt modification expense |
|
|
- |
|
|
|
- |
|
|
|
0.10 |
|
|
|
- |
|
|
|
- |
|
| - Loss on extinguishment of debt |
|
|
- |
|
|
|
- |
|
|
|
- |
|
|
|
0.16 |
|
|
|
- |
|
| - Litigation proceeds |
|
|
- |
|
|
|
- |
|
|
|
- |
|
|
|
- |
|
|
|
- |
|
| - Pension termination |
|
|
- |
|
|
|
0.22 |
|
|
|
- |
|
|
|
- |
|
|
|
- |
|
| - COVID-19 (2) |
|
|
- |
|
|
|
- |
|
|
|
0.05 |
|
|
|
- |
|
|
|
- |
|
| - Adjustments on derivative not classified as hedge (3) |
|
|
- |
|
|
|
- |
|
|
|
0.09 |
|
|
|
(0.04 |
) |
|
|
(0.02 |
) |
| - Other charges (4) |
|
|
0.03 |
|
|
|
- |
|
|
|
0.01 |
|
|
|
0.02 |
|
|
|
0.02 |
|
| |
|
|
|
|
|
|
|
|
|
|
|
|
|
|
|
|
|
|
|
|
| Adjusted earnings per common share - dilutive (non-GAAP) |
|
$ |
2.04 |
|
|
$ |
2.42 |
|
|
$ |
1.18 |
|
|
$ |
1.67 |
|
|
$ |
1.84 |
|
| (1) |
Reflects $900 in reversal of earnout compensation related to Dejana in the year ended December 31, 2018. Reflects $217 in reversal of earnout compensation related to Henderson, and $200 in reversal of earnout compensation related to Dejana in the year ended December 31, 2019. Reflects $17 in reversal of earnout compensation related to Henderson, and $2,000 in reversal of earnout compensation related to Dejana in the year ended December 31, 2020. |
| (2) |
Reflects incremental costs incurred related to the COVID-19 pandemic for the periods presented. Such COVID-19 related costs include increased expenses directly related to the pandemic, and do not include either production related overhead inefficiencies or lost or deferred sales. |
| (3) |
Reflects non-cash mark-to-market and amortization adjustments on an interest rate swap not classified as a hedge for the periods presented. |
| (4) |
Reflects expenses and accrual reversals for one time, unrelated legal and consulting fees, severance, restructuring charges, and loss on disposal of fixed assets related to facility relocation for the periods presented. |
Future Obligations and Commitments
Contractual Obligations
We are subject to certain contractual obligations, including long‑term debt and related interest. We have net unrecognized tax benefits of $2.1 million as of December 31, 2022. However, we cannot make a reasonably reliable estimate of the period of potential cash settlement of the underlying liabilities; therefore, we have not included unrecognized tax benefits in calculating the obligations set forth in the following table of significant contractual obligations as of December 31, 2022.
| (Dollars in thousands) |
|
Total |
|
|
Less than 1 year |
|
|
1 - 3 years |
|
|
3 - 5 years |
|
|
More than 5 years |
|
| |
|
|
|
|
|
|
|
|
|
|
|
|
|
|
|
|
|
|
|
|
| Long-term debt (1) |
|
$ |
207,737 |
|
|
$ |
11,137 |
|
|
$ |
33,525 |
|
|
$ |
163,075 |
|
|
$ |
- |
|
| Operating leases - third parties (2) |
|
|
21,038 |
|
|
|
5,678 |
|
|
|
8,800 |
|
|
|
4,383 |
|
|
|
2,177 |
|
| Interest on long-term debt (3) |
|
|
41,331 |
|
|
|
12,791 |
|
|
|
23,363 |
|
|
|
5,177 |
|
|
|
- |
|
| |
|
|
|
|
|
|
|
|
|
|
|
|
|
|
|
|
|
|
|
|
| Total contracted cash obligations |
|
$ |
270,106 |
|
|
$ |
29,606 |
|
|
$ |
65,688 |
|
|
$ |
172,635 |
|
|
$ |
2,177 |
|
| (1) |
Long‑term debt obligation is presented net of discount of $0.4 million at December 31, 2022. |
| (2) |
Relates to real estate and equipment operating leases with third parties, including five operating leases for Henderson upfit and service center locations and eleven operating leases for Dejana locations. |
| (3) |
Assumes all debt will remain outstanding until maturity. Interest payments were calculated using interest rates in effect as of December 31, 2022. |
Senior Credit Facilities
See Note 9 for a description of our senior credit facilities and other debt.
Deductibility of Intangible and Goodwill Expense
We possess a favorable tax structure where annual tax‑deductible intangible and goodwill amortization expense may be utilized in the event we have sufficient taxable income to utilize such benefit. As we have previously acquired businesses possessing significant intangible assets and goodwill, we have created a favorable tax structure where income tax expense is greater than book amortization expense. We expect the deductibility of intangible assets and goodwill amortization expense to exceed book by approximately $2.3 million in the year ended December 31, 2023 if we have the taxable income to utilize such benefit.
Impact of Inflation
Inflation in materials, freight and labor had a material impact on our profitability in 2021 and 2022, and we expect ongoing inflationary pressures may also impact our profitability in 2023. While we anticipate being able to fully cover this inflation by raising prices, there may be a timing difference of when we incur the increased costs and when we realize the higher prices in our backlog. In 2022 and in previous years, we experienced significant increases in steel costs, but were able or expect to be able to mitigate the effects of these increases through both temporary and permanent steel surcharges; we expect, but cannot be certain, that we will be able to do the same going forward. See “Risk Factors— The price of steel, a commodity necessary to manufacture our products, is highly variable. If the price of steel increases, our gross margins could decline”.
Seasonality and Year‑To‑Year Variability
While our Work Truck Solutions segment has limited seasonality and variability, our Work Truck Attachments segment is seasonal and also varies from year‑to‑year. Consequently, our Work Truck Attachments segment results of operations and financial condition vary from quarter‑to‑quarter and from year‑to‑year as well. In addition, because of this seasonality and variability, our Work Truck Attachments segment results of operations for any quarter may not be indicative of results of operations that may be achieved for a subsequent quarter or the full year, and may not be similar to results of operations experienced in prior years.
Sales of our Work Truck Attachments segment products are significantly impacted by the level, timing and location of snowfall, with sales in any given year and region most heavily influenced by snowfall levels in the prior snow season (which we consider to begin in October and end in March) in that region. This is due to the fact that end‑user demand for our Work Truck Attachments products is driven primarily by the condition of their snow and ice control equipment, and in the case of professional snowplowers, by their financial ability to purchase new or replacement snow and ice control equipment, both of which are significantly affected by snowfall levels. Heavy snowfall during a given winter causes usage of our Work Truck Attachments products to increase, resulting in greater wear and tear to our products and a shortening of their life cycles, thereby creating a need for replacement snow and ice control equipment and related parts and accessories. In addition, when there is a heavy snowfall in a given winter, the increased income our professional snowplowers generate from their professional snowplow activities provides them with increased purchasing power to purchase replacement snow and ice control equipment prior to the following winter. To a lesser extent, sales of our Work Truck Attachments products are influenced by the timing of snowfall in a given winter. Because an early snowfall can be viewed as a sign of a heavy upcoming snow season, our Work Truck Attachments segment’s end‑users may respond to an early snowfall by purchasing replacement snow and ice control equipment during the current season rather than delaying purchases until after the season is over when most purchases are typically made by end‑users.
We attempt to manage the seasonal impact of snowfall on our Work Truck Attachments segment revenues in part through our pre‑season sales program, which involves actively soliciting and encouraging pre‑season distributor orders in the second and third quarters by offering our distributors a combination of pricing, payment and freight incentives during this period. These pre‑season sales incentives encourage our distributors to re‑stock their inventory during the second and third quarters in anticipation of the peak fourth quarter retail sales period by offering favorable pre‑season pricing and payment deferral until the fourth quarter. As a result, we tend to generate our greatest volume of sales (an average of over two‑thirds over the last ten years) during the second and third quarters, providing us with manufacturing visibility for the remainder of the year. By contrast, our revenue and operating results tend to be lowest during the first quarter as management believes our end‑users prefer to wait until the beginning of a snow season to purchase new equipment and as our distributors sell off inventory and wait for our pre‑season sales incentive period to re‑stock inventory. Fourth quarter sales vary from year‑to‑year as they are primarily driven by the level, timing and location of snowfall during the quarter. This is because typically most of our fourth quarter sales and shipments consist of re‑orders by distributors seeking to restock inventory to meet immediate customer needs caused by snowfall during the winter months.
Our Work Truck Attachments segment revenue and operating results tend to be lowest during the first quarter, during which period we typically experience negative earnings as the snow season draws to a close. Our Work Truck Attachments segment first quarter revenue has varied from approximately $19.1 million to approximately $45.8 million between 2017 and 2022. During the last five‑year period, net income (loss) during the first quarter has varied from net income of approximately $1.5 million to a net loss of approximately $7.2 million, with an average net loss of $1.8 million.
While our Work Truck Attachments monthly working capital has averaged approximately $63.6 million from 2020 to 2022, because of the seasonality of our sales, we experience seasonality in our working capital needs as well. In the first quarter we require capital as we are generally required to build our inventory in anticipation of our second and third quarter sales seasons. During the second and third quarters, our working capital requirements rise as our accounts receivables increase as a result of the sale and shipment of products ordered through our pre‑season sales program and we continue to build inventory. Working capital requirements peak towards the end of the third quarter (reaching an average peak of approximately $73.9 million over the prior three years) and then begin to decline through the fourth quarter through a reduction in accounts receivables (as it is in the fourth quarter that we receive a majority of the payments for previously shipped products).
We also attempt to manage the impact of seasonality and year‑to‑year variability on our business costs through the effective management of our assets. See “Business—Our Business Strategy—Aggressive Asset Management and Profit Focus.” Our asset management and profit focus strategies include:
| |
● |
the employment of a highly variable cost structure facilitated by a core group of workers that we supplement with a temporary workforce as sales volumes dictate, which allows us to adjust costs on an as‑needed basis in response to changing demand; |
| |
● |
our enterprise‑wide lean concept, which allows us to adjust production levels up or down to meet demand; |
| |
● |
the pre‑season order program described above, which incentivizes distributors to place orders prior to the retail selling season; and |
| |
● |
a vertically integrated business model. |
These asset management and profit focus strategies, among other management tools, allow us to adjust fixed overhead and selling, general and administrative expenditures to account for the year‑to‑year variability of our sales volumes. Management currently estimates that consolidated annual fixed overhead expenses generally range from approximately $65.0 million in low sales volume years to approximately $80.0 million in high sales volume years. Further, management currently estimates that consolidated annual sales, general and administrative expenses other than amortization generally approximate $80.0 million, but can be reduced to approximately $65.0 million to maximize cash flow in low sales volume years, and can increase to approximately $90.0 million to maintain customer service and responsiveness in high sales volume years.
Additionally, although modest, our annual capital expenditure requirements, which are normally budgeted around 2-3% of net sales, can be temporarily reduced by up to approximately 40% in response to actual or anticipated decreases in sales volumes. If we are unsuccessful in our asset management initiatives, the seasonality and year‑to‑year variability effects on our business may be compounded and in turn our results of operations and financial condition may suffer.
Item 7A. Quantitative and Qualitative Disclosures About Market Risk
Quantitative and Qualitative Disclosures About Market Risk
We do not use financial instruments for speculative trading purposes, and do not hold any derivative financial instruments that could expose us to significant market risk. Our primary market risk exposures are changes in interest rates and steel price fluctuations.
Interest Rate Risk
We are exposed to market risk primarily from changes in interest rates. Our borrowings, including our term loan and any revolving borrowings under our senior credit facilities, are at variable rates of interest and expose us to interest rate risk. In addition, the interest rate on any revolving borrowings is subject to an increase in the interest rate based on our average daily availability under our revolving credit facility.
As of December 31, 2022, we had outstanding borrowings under our term loan of $207.7 million. A hypothetical interest rate change of 1%, 1.5% and 2% on our term loan would have changed interest incurred for the year ended December 31, 2022 by $0.4 million, $0.7 million and $0.9 million, respectively.
We are party to interest rate swap agreements to reduce our exposure to interest rate volatility. On June 9, 2021, in conjunction with entering into our Credit Agreement, we re-designated our swap. As a result, the swap will be recorded at fair value with changes recorded in Accumulated other comprehensive income (loss). The amortization from Accumulated other comprehensive income into earnings from the previous de-designation has been adjusted as of June 9, 2021 to include the de-recognition of previously recognized mark-to-market gains and the amortization of the off-market component as of the re-designation date, and will continue to be recognized through the life of the swap. On May 19, 2022, we entered into an interest rate swap agreement to further reduce our exposure to interest rate volatility. The interest rate swap has a notional amount of $125.0 million, effective for the period May 31, 2024 through June 9, 2026. We may have counterparty credit risk resulting from the interest rate swap, which we monitor on an on-going basis. The risk lies with two global financial institutions. Under the interest rate swap agreement, we will either receive or make payments on a monthly basis based on the differential between 2.718% and SOFR. The interest rate swap is accounted for as a cash flow hedge. See Note 9 to our Unaudited Condensed Consolidated Financial Statements for additional details on our interest rate swap agreements.
The interest rate swaps' positive fair value at December 31, 2022 was $7.0 million, of which $4.1 million and $2.9 million are included in Prepaid and other current assets and Other long-term assets on the Consolidated Balance Sheet, respectively.
As of December 31, 2022, we had no outstanding borrowings under our revolving credit facility. A hypothetical interest rate change of 1%, 1.5% and 2% on our revolving credit facility would have changed interest incurred for the year ended December 31, 2022 by $0.4 million, $0.6 million and $0.8 million, respectively.
Commodity Price Risk
In the normal course of business, we are exposed to market risk related to our purchase of steel, the primary commodity upon which our manufacturing depends. While steel is typically available from numerous suppliers, the price of steel is a commodity subject to fluctuations that apply across broad spectrums of the steel market. We do not use any derivative or hedging instruments to manage the price risk. If the price of steel increases, including as a result of tariffs, our variable costs could also increase. While historically we have successfully mitigated these increased costs through the implementation of either permanent price increases and/or temporary invoice surcharges, there may be timing differences between when we realize the price increases and incur the increased costs, and in the future we may not be able to successfully mitigate these costs, which could cause our gross margins to decline. If our costs for steel were to increase by $1.00 in a period in which we were not able to pass any of this increase onto our customers and distributors, our gross margins would decline by $1.00 in that period.
Item 8. Financial Statements and Supplementary Data
The financial statements are included in this report beginning on page F‑2.
Item 9. Changes In and Disagreements with Accountants on Accounting and Financial Disclosures
None
Item 9A. Controls and Procedures
Disclosure Controls and Procedures
Our management, with the participation of our Chief Executive Officer and Chief Financial Officer, carried out an evaluation of the effectiveness of the design and operation of our disclosure controls and procedures (the “Evaluation”) as of the last day of the period covered by this report.
Based upon the Evaluation, our Chief Executive Officer and Chief Financial Officer concluded that our disclosure controls and procedures were effective as of December 31, 2022. Disclosure controls and procedures are defined by Rules 13a‑15(e) and 15d‑15(e) under the Securities Exchange Act of 1934 (the “Exchange Act”) as controls and other procedures that are designed to ensure that information required to be disclosed by us in the reports that we file or submit under the Exchange Act is recorded, processed, summarized and reported within the time periods specified by the SEC’s rules and forms. Disclosure controls and procedures include, without limitation, controls and procedures designed to ensure that information required to be disclosed by us in the reports that we file or submit under the Exchange Act is accumulated and communicated to our management, including our Chief Executive Officer and Chief Financial Officer, as appropriate to allow timely decisions regarding required disclosures.
It should be noted that the design of any system of controls is based in part upon certain assumptions about the likelihood of future events, and there can be no assurance that any design will succeed in achieving its stated goals under all potential future conditions, regardless of how remote.
Management’s Report on Internal Control Over Financial Reporting
Our management is responsible for establishing and maintaining adequate internal control over financial reporting. Our internal control system was designed to provide reasonable assurance to our management and Board of Directors regarding the preparation and fair presentation of our published financial statements.
All internal control systems, no matter how well designed, have inherent limitations. Therefore, even those systems determined to be effective can provide only reasonable assurance with respect to financial statement preparation and presentation.
Our management, with the participation of our Chief Executive Officer and Chief Financial Officer, evaluated the effectiveness of our internal control over financial reporting as of December 31, 2022. In making this assessment, management used the criteria set forth by the Committee of Sponsoring Organizations of the Treadway Commission (“COSO”) in Internal Control—Integrated Framework (2013 framework). Based on its assessment, management believes that, as of December 31, 2022, our internal control over financial reporting was effective based on those criteria.
Deloitte & Touche LLP (PCAOB ID No. 34), an independent registered public accounting firm, has audited the Consolidated Financial Statements included in this Annual Report on Form 10‑K and, as part of its audit, has issued an attestation report, included herein, on the effectiveness of our internal control over financial reporting at December 31, 2022.
Changes in Internal Control Over Financial Reporting
During the last fiscal quarter of the period covered by this report, there were no changes in our internal controls over financial reporting that have materially affected, or are reasonably likely to materially affect such controls.
Item 9B. Other Information
None
Item 9C. Disclosure Regarding Foreign Jurisdictions that Prevent Inspections
Not applicable.
PART III
Item 10. Directors, Executive Officers and Corporate Governance
The information included under the captions “Election of Directors” and “Board of Directors and Corporate Governance” in the Company’s definitive proxy statement, which is expected to be filed pursuant to Regulation 14A within 120 days following the end of the fiscal year covered by this report (the “Proxy Statement”), is hereby incorporated by reference. The information required by Item 10 with respect to our Executive Officers is included in Part I of this Annual Report on Form 10‑K.
We have adopted a Code of Business Conduct and Ethics that applies to our directors, principal executive officer, principal financial officer and principal accounting officer, as well as all of our employees. We have posted a copy of the Code of Business Conduct and Ethics on our website at www.douglasdynamics.com. The Code of Business Conduct and Ethics is also available in print to any stockholder who requests it in writing from the Corporate Secretary at 11270 W. Park Place Suite 300, Milwaukee, WI 53224. We intend to post on our website any amendments to, or waivers (with respect to our principal executive officer, principal financial officer and controller) from, the Code of Business Conduct and Ethics within four business days of any such amendment or waiver. We are not including the information contained on our website as part of, or incorporating it by reference into, this report.
Item 11. Executive Compensation
The information required in Item 11 is incorporated by reference to the information in the Proxy Statement under the captions “Corporate Governance—Compensation Committee Interlocks and Insider Participation,” “Compensation Discussion and Analysis”, “Executive Compensation,” “Director Compensation” and “Compensation Committee Report.”
Item 12. Security Ownership of Certain Beneficial Owners and Management and Related Shareholder Matters
The information required in Item 12 is incorporated by reference to the information in the Proxy Statement under the captions “Corporate Governance—Significant Stockholders” and “—Executive Officers and Directors.”
Securities Authorized for Issuance under Equity Compensation Plans
The following table sets forth information with respect to compensation plans under which equity securities of the Company are authorized for issuance as of December 31, 2022.
Equity Compensation Plan Information
| Plan Category |
|
Number of securities to be issued upon exercise of outstanding options, warrants and rights |
|
|
Weighted - average exercise price of outstanding options, warrants and rights |
|
|
Number of securities remaining available for future issuance under equity compensation plans (excluding securities reflected in column) (1) (2) |
|
| Equity Compensation plans approved by security holders: |
|
|
|
|
|
|
|
|
|
|
|
|
| 2010 Stock Incentive Plan : |
|
|
214,085 |
|
|
$ |
- |
|
|
|
531,267 |
|
| Equity compensation plans not approved by security holders |
|
|
- |
|
|
|
- |
|
|
|
- |
|
| Total |
|
|
214,085 |
|
|
$ |
- |
|
|
|
531,267 |
|
| (1) |
Excludes 246,479 shares of restricted stock previously granted under the Amended and Restated 2010 Stock Incentive Plan. |
| (2) |
Calculated excluding the 214,085 securities shown as to be issued upon exercise of outstanding options, warrants and rights under the 2010 Stock Incentive Plan in column (a), which are subject to performance share unit awards and have no exercise price. |
Item 13. Certain Relationships and Related Transactions, and Director Independence
The information required in Item 13 is incorporated by reference to the information in the Proxy Statement under the caption “Corporate Governance.”
Item 14. Principal Accounting Fees and Services
The information required in Item 14 is incorporated by reference to the information in the Proxy Statement under the caption “Ratification of Appointment of Independent Registered Public Accounting Firm.”
PART IV
Item 15. Exhibits and Financial Statement Schedules
| (a) |
Documents filed as part of this report: |
| |
(1) |
Consolidated Financial Statements: |
See “Index to Consolidated Financial Statements” on page F‑1, the Report of Independent Registered Public Accounting Firm on page F‑2 through F‑4 and the Consolidated Financial Statements beginning on page F‑5, all of which are incorporated herein by reference.
| |
(2) |
Financial Statement Schedules: |
All schedules have been omitted because the information required in these schedules is included in the Notes to the Consolidated Financial Statements.
See “Exhibit Index” of this Form 10‑K, beginning on the following page.
Item 16. Form 10-K Summary
Not applicable
Exhibit Index
| Exhibit
Number |
|
Title |
| 2.1 |
|
Asset Purchase Agreement, dated May 6, 2013 by and between Acquisition Tango LLC, TrynEx, Inc. and shareholders of TrynEx, Inc. named therein [Incorporated by reference to Exhibit 2.1 to Douglas Dynamics, Inc.’s Current Report on Form 8‑K filed May 6, 2013 (File No. 001‑34728)]. |
| 2.2 |
|
First Amendment, dated August 6, 2013, to the Asset Purchase Agreement dated May 6, 2013 by and between TrynEx International LLC, Apex International, Inc. and shareholders of Apex International, Inc. named therein [Incorporated by reference to Exhibit 2.1 to Douglas Dynamics, Inc.’s Current Report on Form 8‑K filed August 5, 2013 (File No. 001‑34728)]. |
| 2.3 |
|
Merger Agreement, dated November 24, 2014, among Douglas Dynamics, Inc., DDIZ Acquisition, Inc., Henderson Enterprises Group, Inc. and the stockholder representative named therein [Incorporated by reference to Exhibit 2.1 to Douglas Dynamics, Inc.’s Current Report on Form 8-K filed November 25, 2014 (File No. 001-34728)]. |
| 2.4 |
|
Asset Purchase Agreement, dated June 15, 2016, among Acquisition Delta LLC, Peter Paul Dejana Family Trust Dated 12/31/98, Dejana Truck & Utility Equipment Company, Inc. and Andrew Dejana (as Appointed Agent) [Incorporated by reference to Exhibit 2.1 to Douglas Dynamics, Inc.’s Current Report on Form 8-K filed on June 20, 2016 (File No. 001-34728)]. |
| 2.5 |
|
First Amendment, dated February 27, 2017, to the Asset Purchase Agreement, dated June 15, 2016, among Acquisition Delta LLC, Peter Paul Dejana Family Trust Dated 12/31/98, Dejana Truck & Utility Equipment Company, Inc. and Andrew Dejana (as Appointed Agent) [Incorporated by reference to Exhibit 2.1 to Douglas Dynamics, Inc.’s Current Report on Form 8-K filed on March 1, 2017 (File No. 001-34728)]. |
| 2.6 |
|
Second Amendment, dated September 20, 2017, to the Asset Purchase Agreement, dated June 15, 2016 and amended on February 27, 2017, among Dejana Truck & Utility Equipment Company, LLC (formerly known as Acquisition Delta LLC), Peter Paul Dejana Family Trust 12/31/98, Peteco Kings Park Inc. (formerly known as Dejana Truck & Utility Equipment Company, Inc.) and Andrew Dejana, as appointed agent [Incorporated by reference to Exhibit 2.1 to Douglas Dynamics, Inc.’s Current Report on Form 8-K filed on September 26, 2017 (File No. 001-34728)]. |
| 3.1 |
|
Fourth Amended and Restated Certificate of Incorporation of Douglas Dynamics, Inc. [Incorporated by reference to Exhibit 3.3 to Douglas Dynamics, Inc.’s Registration Statement on Form S‑1 (Registration No. 333‑164590)]. |
| 3.2 |
|
Fourth Amended and Restated Bylaws of Douglas Dynamics, Inc. [Incorporated by reference to Exhibit 3.2 to Douglas Dynamics, Inc.’s Current Report on Form 8-K filed on January 4, 2019 (File No. 001-34728)]. |
| 4.1 |
|
Description of Registrant’s Securities [Incorporated by reference to Exhibit 4.1 to Douglas Dynamics, Inc.'s Annual Report on Form 10-K for the period ending December 31, 2021 (File No. 001-34728)]. |
| 10.1 |
|
Credit Agreement, dated as of June 9, 2021, among Douglas Dynamics, L.L.C., Fisher, LLC, Trynex International LLC, Henderson Enterprises Group, Inc., Henderson Products, Inc., and Dejana Truck & Utility Equipment Company, LLC, Douglas Dynamics, Inc., the banks and financial institutions listed therein, as lenders, JPMorgan Chase Bank, N.A., as administrative agent, J.P. Morgan Chase Bank, N.A. and CIBC Bank USA, as joint lead arrangers and joint bookrunners, CIBC Bank USA, as syndication agent, and Bank of America, N.A. and Citizens Bank, N.A., as co-documentation agents [Incorporated by reference to Exhibit 10.1 to Douglas Dynamics, Inc.’s Current Report on Form 8-K dated June 9, 2021 (File No. 001-34728)]. |
| 10.2 |
|
Amendment No. 1 to Credit Agreement and Revolving Credit Commitment Increase Supplement, dated as of January 5, 2023, among Douglas Dynamics, L.L.C., Fisher, LLC, Trynex International LLC, Henderson Enterprises Group, Inc., Henderson Products, Inc., and Dejana Truck & Utility Equipment Company, LLC, Douglas Dynamics, Inc., the banks and financial institutions listed therein, as lenders, and JPMorgan Chase Bank, N.A., as administrative agent (which includes the marked Credit Agreement as Exhibit A thereto) [Incorporated by reference to Exhibit 10.1 to Douglas Dynamics, Inc.'s Current Report on Form 8-K filed on January 6, 2023 (file No. 001-34728)]. |
| 10.3# |
|
Amended and Restated Employment Agreement between Sarah Lauber and Douglas Dynamics, LLC, effective October 31, 2022 [Incorporated by reference to Exhibit 10.2 to Douglas Dynamics, Inc.’s Quarterly Report on Form 10-Q for the quarterly period ended September 30, 2022 (File No. 001-34728)]. |
| 10.4# |
|
Employment Agreement between Keith Hagelin and Douglas Dynamics, LLC, effective June 30, 2020 [Incorporated by reference to Exhibit 10.3 to Douglas Dynamics, Inc.’s Form 10-Q for the quarterly period ended June 30, 2020 filed with the Securities and Exchange Commission on August 4, 2020 (File No. 001-34728)]. |
| 10.5# |
|
Employment Agreement between Jonathon Sievert and Douglas Dynamics, LLC effective December 22, 2021 [Incorporated by reference to Exhibit 10.1 to Douglas Dynamics, Inc.’s Current Report on Form 8-K filed with the Securities and Exchange Commission on December 28, 2021 (File No. 001-34728)]. |
Exhibit
Number |
|
Title |
| 10.6# |
|
Form of Amended and Restated Deferred Stock Unit Agreement [Incorporated by reference to Exhibit 10.18 to Douglas Dynamics, Inc.’s Registration Statement on Form S‑1/A filed on March 8, 2010 (Registration No. 333‑164590)]. |
| 10.7# |
|
Douglas Dynamics, Inc. Annual Incentive Plan [Incorporated by reference to Exhibit 10.1 to Douglas Dynamics, Inc.’s Quarterly Report on Form 10-Q filed with the Securities and Exchange Commission on May 10, 2016 (File No. 001-34728)]. |
| 10.8# |
|
Douglas Dynamics, Inc. Amended and Restated 2010 Stock Incentive Plan [Incorporated by reference to Appendix A to Douglas Dynamics, Inc.’s definitive proxy statement filed with the Securities and Exchange Commission on March 27, 2020 (File No. 001-34728)]. |
| 10.9# |
|
Form of Restricted Stock Agreement under Douglas Dynamics, Inc. 2010 Stock Incentive Plan [Incorporated by reference to Exhibit 10.33 to Douglas Dynamics, Inc.’s Registration Statement on Form S‑1 (Registration No. 333‑164590)]. |
| 10.10# |
|
Alternative Form of Restricted Stock Agreement under Douglas Dynamics, Inc. 2010 Stock Incentive Plan [Incorporated by reference to Exhibit 10.34 to Douglas Dynamics, Inc.’s Registration Statement on Form S‑1 (Registration No. 333‑164590)]. |
| 10.11# |
|
Form of Restricted Stock Units Agreement under Douglas Dynamics, Inc. 2010 Stock Incentive Plan [Incorporated by reference to Exhibit 10.35 to Douglas Dynamics, Inc.’s Registration Statement on Form S‑1 (Registration No. 333‑164590)]. |
| 10.12# |
|
Form of Nonqualified Stock Option Agreement under Douglas Dynamics, Inc. 2010 Stock Incentive Plan [Incorporated by reference to Exhibit 10.36 to Douglas Dynamics, Inc.’s Registration Statement on Form S‑1 (Registration No. 333‑164590)]. |
| 10.13# |
|
Form of Incentive Stock Option Agreement under 2010 Stock Incentive Plan [Incorporated by reference to Exhibit 10.37 to Douglas Dynamics, Inc.’s Registration Statement on Form S‑1 (Registration No. 333‑ 164590)]. |
| 10.14# |
|
Form of Restricted Stock Grant Notice and Standard Terms and Conditions under the Douglas Dynamics, Inc. 2010 Stock Incentive Plan [Incorporated by reference to Exhibit 10.1 to Douglas Dynamics, Inc.’s Current Report on Form 8‑K filed December 30, 2010 (File No. 001‑34728)]. |
| 10.15# |
|
Form of Restricted Stock Unit Grant Notice and Standard Terms and Conditions under the Douglas Dynamics, Inc. 2010 Stock Incentive Plan [Incorporated by reference to Exhibit 10.2 to Douglas Dynamics, Inc.’s Current Report on Form 8‑K filed December 30, 2010 (File No. 001‑34728)]. |
| 10.16# |
|
Form of Nonemployee Director Restricted Stock Unit Grant Notice and Standard Terms and Conditions under the Douglas Dynamics, Inc. 2010 Stock Incentive Plan [Incorporated by reference to Exhibit 10.3 to Douglas Dynamics, Inc.’s Current Report on Form 8‑K filed December 30, 2010 (File No. 001‑34728)]. |
| 10.17# |
|
Form of Nonemployee Director Restricted Stock Unit Grant Notice and Standard Terms and Conditions under Douglas Dynamics, Inc. 2010 Stock Incentive Plan, effective in 2021[Incorporated by reference to Exhibit 10.1 to Douglas Dynamics, Inc.’s Quarterly Report on Form 10‑Q for the Quarterly period Ended June 30, 2021 (File No. 001‑34728)]. |
| 10.18# |
|
Form of Director and Officer Indemnification Agreement [Incorporated by reference to Exhibit 10.27 to Douglas Dynamics, Inc.’s Registration Statement on Form S‑1/A filed on March 8, 2010 (Registration No. 333‑164590)]. |
| 10.19# |
|
Douglas Dynamics Nonqualified Deferred Compensation Plan [Incorporated by reference to Exhibit 10.34 to Douglas Dynamics, Inc.’s Annual Report on Form 10‑K for the period ending December 31, 2011 (File No. 001-34728)]. |
| 10.20# |
|
Form of Restricted Stock Unit Agreement under Douglas Dynamics, Inc. 2010 Stock Incentive Plan. [Incorporated by reference to Exhibit 10.36 to Douglas Dynamics, Inc.’s Annual Report on Form 10‑K for the period ending December 31, 2012 (File No. 001-34728)]. |
| 10.21# |
|
Form of Performance Share Unit Agreement under Douglas Dynamics, Inc. 2010 Stock Incentive Plan. [Incorporated by reference to Exhibit 10.37 to Douglas Dynamics, Inc.’s Annual Report on Form 10‑K for the period ending December 31, 2012 (File No. 001-34728)]. |
| 10.22# |
|
Form of Nonemployee Director Restricted Stock Unit Grant Notice and Standard Terms and Conditions under Douglas Dynamics, Inc. 2010 Stock Incentive Plan. [Incorporated by reference to Exhibit 10.4 to Douglas Dynamics, Inc.’s Quarterly Report on Form 10‑Q for the Quarterly Period Ended March 31, 2013 (File No. 001‑34728)]. |
Exhibit
Number |
|
Title |
| 10.23# |
|
Form of Grant Notice for Performance Share Units under the Douglas Dynamics, Inc. 2010 Stock Incentive Plan, effective February 19, 2018 [Incorporated by reference to Exhibit 10.41 to Douglas Dynamics, Inc.’s Annual Report on Form 10-K for the period ending December 31, 2018]. |
| 10.24# |
|
Form of Grant Notice for Restricted Stock Units under the Douglas Dynamics, Inc. 2010 Stock Incentive Plan, effective February 19, 2018 [Incorporated by reference to Exhibit 10.42 to Douglas Dynamics, Inc.’s Annual Report on Form 10-K for the period ending December 31, 2018]. |
| 10.25# |
|
Amended and Restated Employment Agreement between James L. Janik and Douglas Dynamics, LLC, effective February 22, 2019 [Incorporated by reference to Exhibit 10.47 to Douglas Dynamics, Inc.’s Annual Report on Form 10-K for the period ending December 31, 2018 (File No. 001-34728)]. |
| 10.26# |
|
Amended and Restated Employment Agreement between Robert McCormick and Douglas Dynamics, LLC, effective October 31, 2022 [Incorporated by reference to Exhibit 10.1 to Douglas Dynamics, Inc.’s Quarterly Report on Form 10-Q for the quarterly period ended September 30, 2022 (File No. 001-34728)]. |
| 10.27# |
|
Form of Nonemployee Director Restricted Stock Unit Grant Notice and Standard Terms and Conditions under the Douglas Dynamics, Inc. 2010 Stock Incentive Plan, effective February 19, 2019 [Incorporated by reference to Exhibit 10.49 to Douglas Dynamics, Inc.’s Annual Report on Form 10-K for the period ending December 31, 2018 (File No. 001-34728)]. |
| 10.28# |
|
Amended and Restated Employment Agreement between Linda Evans and Douglas Dynamics, LLC, effective October 31, 2022 [Incorporated by reference to Exhibit 10.3 to Douglas Dynamics, Inc.’s Quarterly Report on Form 10-Q for the quarterly period ended September 30, 2022 (File No. 001-34728)]. |
| 10.29#* |
|
Employment Agreement between Mark Van Genderen and Douglas Dynamics, LLC, effective January 6, 2023. |
| 21.1* |
|
Subsidiaries of Douglas Dynamics, Inc. |
| 23.1* |
|
Consent of Deloitte & Touche LLP. |
| 31.1* |
|
Certification of the Company’s Chief Executive Officer pursuant to Section 302 of the Sarbanes‑Oxley Act of 2002. |
| 31.2* |
|
Certification of the Company’s Chief Financial Officer pursuant to Section 302 of the Sarbanes‑Oxley Act of 2002. |
| 32.1* |
|
Certification of the Company’s Chief Executive Officer and Chief Financial Officer pursuant to Section 906 of the Sarbanes‑Oxley Act of 2002. |
| 99.1 |
|
Proxy Statement for the 2023 Annual Meeting of Stockholders [To be filed with the Securities and Exchange Commission under Regulation 14A within 120 days after December 31, 2022; except to the extent specifically incorporated by reference, the Proxy Statement for the 2023 Annual Meeting of Stockholders shall not be deemed to be filed with the Securities and Exchange Commission as part of this Annual Report on Form 10‑K] |
| |
|
|
| 101.INS* |
|
Inline XBRL Instance Document |
| 101.SCH* |
|
Inline XBRL Taxonomy Extension Schema |
| 101.CAL* |
|
Inline XBRL Taxonomy Extension Calculation Linkbase |
| 101.DEF* |
|
Inline XBRL Taxonomy Extension Definition Linkbase |
| 101.LAB* |
|
Inline XBRL Taxonomy Extension Label Linkbase |
| 101.PRE* |
|
Inline XBRL Taxonomy Extension Presentation Linkbase |
| 104* |
|
Cover Page Interactive Data File (formatted in Inline XBRL and contained in Exhibit 101) |
| # |
A management contract or compensatory plan or arrangement. |
| |
|
| * |
Filed herewith. |
Signature
Pursuant to the requirements of Section 13 or 15(d) of the Securities Exchange Act of 1934, the Registrant has duly caused this report to be signed on its behalf by the undersigned, thereunto duly authorized, on this 21st day of February, 2023.
| |
DOUGLAS DYNAMICS, INC. |
| |
|
|
| |
By: |
/s/ Robert McCormick |
| |
|
Robert McCormick
President and Chief Executive Officer |
Pursuant to the requirements of the Securities Exchange Act of 1934, this report has been signed below by the following persons on behalf of the Registrant and in the capacities indicated on February 21, 2023.
| /s/ Robert McCormick |
President and Chief Executive Officer |
| Robert McCormick |
(Principal Executive Officer) and Director |
| |
|
| /s/ Sarah Lauber |
Chief Financial Officer & Secretary |
| Sarah Lauber |
(Principal Financial Officer) |
| |
|
| /s/ Jon J. Sisulak |
Vice President, Corporate Controller and Treasurer |
| Jon J. Sisulak |
(Controller) |
| |
|
| /s/ James L. Janik |
Chairman and Director |
| James L. Janik |
| |
|
| /s/ Joher Akolawala |
Director |
| Joher Akolawala |
| |
|
| /s/ Lisa R. Bacus |
Director |
| Lisa R. Bacus |
| |
|
| /s/ Margaret S. Dano |
Director |
| Margaret S. Dano |
| |
|
| /s/ Kenneth W. Krueger |
Director |
| Kenneth W. Krueger |
| |
|
| /s/ James D. Staley |
Director |
| James D. Staley |
| |
|
| /s/ Donald W. Sturdivant |
Director |
| Donald W. Sturdivant |
Index to Consolidated Financial Statements
REPORT OF INDEPENDENT REGISTERED PUBLIC ACCOUNTING FIRM
To the shareholders and the Board of Directors of Douglas Dynamics Inc.
Opinions on the Financial Statements and Internal Control over Financial Reporting
We have audited the accompanying consolidated balance sheets of Douglas Dynamics Inc. and subsidiaries (the "Company") as of December 31, 2022 and 2021, the related consolidated statements of income (loss) and comprehensive income (loss), changes in shareholders' equity, and cash flows, for each of the three years in the period ended December 31, 2022, and the related notes (collectively referred to as the "financial statements"). We also have audited the Company’s internal control over financial reporting as of December 31, 2022, based on criteria established in Internal Control — Integrated Framework (2013) issued by the Committee of Sponsoring Organizations of the Treadway Commission (COSO).
In our opinion, the financial statements referred to above present fairly, in all material respects, the financial position of the Company as of December 31, 2022 and 2021, and the results of its operations and its cash flows for each of the three years in the period ended December 31, 2022, in conformity with accounting principles generally accepted in the United States of America. Also, in our opinion, the Company maintained, in all material respects, effective internal control over financial reporting as of December 31, 2022, based on criteria established in Internal Control — Integrated Framework (2013) issued by COSO.
Basis for Opinions
The Company’s management is responsible for these financial statements, for maintaining effective internal control over financial reporting, and for its assessment of the effectiveness of internal control over financial reporting, included in the accompanying Management's Report on Internal Control Over Financial Reporting. Our responsibility is to express an opinion on these financial statements and an opinion on the Company’s internal control over financial reporting based on our audits. We are a public accounting firm registered with the Public Company Accounting Oversight Board (United States) (PCAOB) and are required to be independent with respect to the Company in accordance with the U.S. federal securities laws and the applicable rules and regulations of the Securities and Exchange Commission and the PCAOB.
We conducted our audits in accordance with the standards of the PCAOB. Those standards require that we plan and perform the audits to obtain reasonable assurance about whether the financial statements are free of material misstatement, whether due to error or fraud, and whether effective internal control over financial reporting was maintained in all material respects.
Our audits of the financial statements included performing procedures to assess the risks of material misstatement of the financial statements, whether due to error or fraud, and performing procedures to respond to those risks. Such procedures included examining, on a test basis, evidence regarding the amounts and disclosures in the financial statements. Our audits also included evaluating the accounting principles used and significant estimates made by management, as well as evaluating the overall presentation of the financial statements. Our audit of internal control over financial reporting included obtaining an understanding of internal control over financial reporting, assessing the risk that a material weakness exists, and testing and evaluating the design and operating effectiveness of internal control based on the assessed risk. Our audits also included performing such other procedures as we considered necessary in the circumstances. We believe that our audits provide a reasonable basis for our opinions.
Definition and Limitations of Internal Control over Financial Reporting
A company’s internal control over financial reporting is a process designed to provide reasonable assurance regarding the reliability of financial reporting and the preparation of financial statements for external purposes in accordance with generally accepted accounting principles. A company’s internal control over financial reporting includes those policies and procedures that (1) pertain to the maintenance of records that, in reasonable detail, accurately and fairly reflect the transactions and dispositions of the assets of the company; (2) provide reasonable assurance that transactions are recorded as necessary to permit preparation of financial statements in accordance with generally accepted accounting principles, and that receipts and expenditures of the company are being made only in accordance with authorizations of management and directors of the company; and (3) provide reasonable assurance regarding prevention or timely detection of unauthorized acquisition, use, or disposition of the company’s assets that could have a material effect on the financial statements.
Because of its inherent limitations, internal control over financial reporting may not prevent or detect misstatements. Also, projections of any evaluation of effectiveness to future periods are subject to the risk that controls may become inadequate because of changes in conditions, or that the degree of compliance with the policies or procedures may deteriorate.
Critical Audit Matter
The critical audit matter communicated below is a matter arising from the current-period audit of the financial statements that was communicated or required to be communicated to the audit committee and that (1) relates to accounts or disclosures that are material to the financial statements and (2) involved our especially challenging, subjective, or complex judgments. The communication of critical audit matters does not alter in any way our opinion on the financial statements, taken as a whole, and we are not, by communicating the critical audit matter below, providing a separate opinion on the critical audit matter or on the accounts or disclosures to which it relates.
Indefinite Lived Intangible Tradename– Dejana– Refer to Note 2 and 8 to the Financial Statements
Critical Audit Matter Description
The Company tests the Dejana indefinite lived intangible tradename for impairment annually or whenever events or changes in circumstances indicate the carrying value may not be recoverable by comparing the fair value of the indefinite lived tradename to its carrying value. The Company determines the fair value of the indefinite lived tradename using the relief from royalty method. The significant assumptions used in the determination of the fair value include revenue attributable to the asset, royalty rate and the discount rate, reflecting the risks inherent in the future cash flow stream. Changes in these assumptions could have significant impacts on the fair value of the indefinite lived intangible amount, and the amount of an impairment charge, if any. The Dejana indefinite lived intangible balance was $14 million as of December 31, 2022. The fair value of the Dejana indefinite lived intangible tradename exceeded the carrying value as of the measurement date and, therefore, no impairment was recognized.
The significant estimates and assumptions management makes to estimate the fair value and the sensitivity of Dejana operations to the near-term business disruption from supply chain constraints and rising costs required a high degree of auditor judgment and an increased extent of effort, including the need to involve our fair value specialists.
How the Critical Audit Matter Was Addressed in the Audit
Our audit procedures related to forecasts of future revenue growth, and the selection of royalty and discount rates for the Dejana indefinite lived tradename included the following, among others:
| | ● | We tested the effectiveness of internal controls over the indefinite lived intangible tradename, including those related to management’s revenue growth assumptions as well as the selection of the royalty and discount rates. |
| | ● | We evaluated management’s ability to accurately forecast revenue by performing a retrospective review of prior forecasts compared to actual results. |
| | ● | We evaluated the reasonableness of management’s forecasts, including the impact of near-term business disruption from supply chain constraints and rising costs, by comparing the forecasts to (1) historical results, (2) internal communications to management and the Board of Directors, and (3) forecasted information included in analyst and industry reports of the Company. |
| | ● | With the assistance of our fair value specialists, we evaluated the fair value methodology, the royalty rate and the discount rate, including testing the underlying source information and the mathematical accuracy of the calculations. Specific to the discount rate, we considered the inputs and calculations, and we developed a range of independent estimates and compared those to the respective discount rates selected by management. Specific to the royalty rate, we considered the external information used in developing management’s estimate, and we developed a range of independent estimates which we compared to the royalty rate selected by management. |
/s/ DELOITTE & TOUCHE LLP
Milwaukee, Wisconsin
February 21, 2023
We have served as the Company's auditor since 2017.
DOUGLAS DYNAMICS, INC.
CONSOLIDATED BALANCE SHEETS
(Dollars In Thousands, Except Per Share Data)
| | | December 31, | | | December 31, | |
| | | 2022 | | | 2021 | |
| | | | | | | | | |
| Assets | | | | | | | | |
| Current assets: | | | | | | | | |
| Cash and cash equivalents | | $ | 20,670 | | | $ | 36,964 | |
| Accounts receivable, net | | | 86,765 | | | | 71,035 | |
| Inventories | | | 136,501 | | | | 104,019 | |
| Inventories - truck chassis floor plan | | | 1,211 | | | | 2,655 | |
| Refundable income taxes paid | | | - | | | | 1,222 | |
| Prepaid and other current assets | | | 7,774 | | | | 4,536 | |
| Total current assets | | | 252,921 | | | | 220,431 | |
| Property, plant and equipment, net | | | 68,660 | | | | 66,787 | |
| Goodwill | | | 113,134 | | | | 113,134 | |
| Other intangible assets, net | | | 131,589 | | | | 142,109 | |
| Operating leases - right of use asset | | | 17,432 | | | | 18,462 | |
| Non-qualified benefit plan assets | | | 8,874 | | | | 10,347 | |
| Other long-term assets | | | 4,281 | | | | 1,206 | |
| Total assets | | $ | 596,891 | | | $ | 572,476 | |
| | | | | | | | | |
| Liabilities and shareholders' equity | | | | | | | | |
| Current liabilities: | | | | | | | | |
| Accounts payable | | $ | 49,252 | | | $ | 27,375 | |
| Accrued expenses and other current liabilities | | | 30,484 | | | | 36,126 | |
| Floor plan obligations | | | 1,211 | | | | 2,655 | |
| Operating lease liability - current | | | 4,862 | | | | 4,623 | |
| Income tax payable | | | 3,485 | | | | - | |
| Current portion of long-term debt | | | 11,137 | | | | 11,137 | |
| Total current liabilities | | | 100,431 | | | | 81,916 | |
| Retiree benefits and deferred compensation | | | 14,650 | | | | 17,170 | |
| Deferred income taxes | | | 29,837 | | | | 29,789 | |
| Long-term debt, less current portion | | | 195,299 | | | | 206,058 | |
| Operating lease liability - noncurrent | | | 14,025 | | | | 15,408 | |
| Other long-term liabilities | | | 5,547 | | | | 7,525 | |
| Commitments and contingencies (Note 16) | | | | | | | | |
| Shareholders' equity: | | | | | | | | |
| Common Stock, par value $0.01, 200,000,000 shares authorized, 22,886,793 and 22,980,951 shares issued and outstanding at December 31, 2022 and December 31, 2021, respectively | | | 229 | | | | 230 | |
| Additional paid-in capital | | | 164,281 | | | | 163,552 | |
| Retained earnings | | | 63,464 | | | | 51,881 | |
| Accumulated other comprehensive income (loss), net of tax | | | 9,128 | | | | (1,053 | ) |
| Total shareholders' equity | | | 237,102 | | | | 214,610 | |
| Total liabilities and shareholders' equity | | $ | 596,891 | | | $ | 572,476 | |
See accompanying Notes to Consolidated Financial Statements
DOUGLAS DYNAMICS, INC.
CONSOLIDATED STATEMENTS OF INCOME (LOSS)
(In Thousands, Except Per Share Data)
| |
|
Years ended December 31, |
|
| |
|
2022 |
|
|
2021 |
|
|
2020 |
|
| Net sales |
|
$ |
616,068 |
|
|
$ |
541,453 |
|
|
$ |
480,154 |
|
| Cost of sales |
|
|
464,612 |
|
|
|
399,581 |
|
|
|
351,874 |
|
| Gross profit |
|
|
151,456 |
|
|
|
141,872 |
|
|
|
128,280 |
|
| Selling, general, and administrative expense |
|
|
82,183 |
|
|
|
78,844 |
|
|
|
64,617 |
|
| Impairment charges |
|
|
- |
|
|
|
1,211 |
|
|
|
127,872 |
|
| Intangibles amortization |
|
|
10,520 |
|
|
|
10,682 |
|
|
|
10,931 |
|
| Income (loss) from operations |
|
|
58,753 |
|
|
|
51,135 |
|
|
|
(75,140 |
) |
| Interest expense, net |
|
|
(11,253 |
) |
|
|
(11,839 |
) |
|
|
(20,238 |
) |
| Debt modification expense |
|
|
- |
|
|
|
- |
|
|
|
(3,542 |
) |
| Loss on extinguishment of debt |
|
|
- |
|
|
|
(4,936 |
) |
|
|
- |
|
| Other income (expense), net |
|
|
(139 |
) |
|
|
228 |
|
|
|
91 |
|
| Income (loss) before taxes |
|
|
47,361 |
|
|
|
34,588 |
|
|
|
(98,829 |
) |
| Income tax expense (benefit) |
|
|
8,752 |
|
|
|
3,897 |
|
|
|
(12,276 |
) |
| Net income (loss) |
|
$ |
38,609 |
|
|
$ |
30,691 |
|
|
$ |
(86,553 |
) |
| Earnings (loss) per share: |
|
|
|
|
|
|
|
|
|
|
|
|
| Basic earnings (loss) per common share attributable to common shareholders |
|
$ |
1.65 |
|
|
$ |
1.31 |
|
|
$ |
(3.81 |
) |
| Earnings (loss) per common share assuming dilution attributable to common shareholders |
|
$ |
1.63 |
|
|
$ |
1.29 |
|
|
$ |
(3.81 |
) |
| Cash dividends declared and paid per share |
|
$ |
1.16 |
|
|
$ |
1.14 |
|
|
$ |
1.12 |
|
See accompanying Notes to Consolidated Financial Statements
DOUGLAS DYNAMICS, INC.
CONSOLIDATED STATEMENTS OF COMPREHENSIVE INCOME (LOSS)
(In Thousands)
| | | Years ended December 31, | |
| | | 2022 | | | 2021 | | | 2020 | |
| Net income (loss) | | $ | 38,609 | | | $ | 30,691 | | | $ | (86,553 | ) |
| Other comprehensive income (loss): | | | | | | | | | | | | |
| Adjustment for pension and postretirement benefit liability, net of tax of ($176) in 2022, ($120) in 2021 and $34 in 2020 | | | 541 | | | | 329 | | | | (97 | ) |
| Adjustment for interest rate swap, net of tax of ($3,140) in 2022, ($1,370) in 2021 and $899 in 2020 | | | 9,640 | | | | 4,113 | | | | (2,584 | ) |
| Total other comprehensive income (loss), net of tax | | | 10,181 | | | | 4,442 | | | | (2,681 | ) |
| Comprehensive income (loss) | | $ | 48,790 | | | $ | 35,133 | | | $ | (89,234 | ) |
See accompanying Notes to Consolidated Financial Statements
DOUGLAS DYNAMICS, INC.
CONSOLIDATED STATEMENTS OF CHANGES IN SHAREHOLDERS’ EQUITY
(Dollars In Thousands)
| | | | | | | | | | | | | | | | | | | Accumulated | | | | | |
| | | | | | | | | | | Additional | | | | | | | Other | | | | | |
| | | Common Stock | | | Paid-in | | | Retained | | | Comprehensive | | | | | |
| | | Shares | | | Dollars | | | Capital | | | Earnings | | | Income (Loss) | | | Total | |
| | | | | | | | | | | | | | | | | | | | | | | | | |
| Balance at December 31, 2019 | | | 22,795,412 | | | $ | 228 | | | $ | 155,001 | | | $ | 160,748 | | | $ | (2,814 | ) | | $ | 313,163 | |
| Net loss | | | — | | | | — | | | | — | | | | (86,553 | ) | | | — | | | | (86,553 | ) |
| Dividends paid | | | — | | | | — | | | | — | | | | (25,926 | ) | | | — | | | | (25,926 | ) |
| Impact due to adoption of ASC 2016-13 (credit losses), net of tax of $193 | | | — | | | | — | | | | — | | | | (557 | ) | | | — | | | | (557 | ) |
| Adjustment for pension and postretirement benefit liability, net of tax of $34 | | | — | | | | — | | | | — | | | | — | | | | (97 | ) | | | (97 | ) |
| Adjustment for interest rate swap, net of tax of $899 | | | — | | | | — | | | | — | | | | — | | | | (2,584 | ) | | | (2,584 | ) |
| Shares withheld on restricted stock vesting | | | — | | | | — | | | | (72 | ) | | | — | | | | — | | | | (72 | ) |
| Stock based compensation | | | 62,045 | | | | 1 | | | | 2,829 | | | | — | | | | — | | | | 2,830 | |
| Balance at December 31, 2020 | | | 22,857,457 | | | $ | 229 | | | $ | 157,758 | | | $ | 47,712 | | | $ | (5,495 | ) | | $ | 200,204 | |
| Net income | | | — | | | | — | | | | — | | | | 30,691 | | | | — | | | | 30,691 | |
| Dividends paid | | | — | | | | — | | | | — | | | | (26,522 | ) | | | — | | | | (26,522 | ) |
| Adjustment for pension and postretirement benefit liability, net of tax of ($120) | | | — | | | | — | | | | — | | | | — | | | | 329 | | | | 329 | |
| Adjustment for interest rate swap, net of tax of ($1,370) | | | — | | | | — | | | | — | | | | — | | | | 4,113 | | | | 4,113 | |
| Stock based compensation | | | 123,494 | | | | 1 | | | | 5,794 | | | | — | | | | — | | | | 5,795 | |
| Balance at December 31, 2021 | | | 22,980,951 | | | $ | 230 | | | $ | 163,552 | | | $ | 51,881 | | | $ | (1,053 | ) | | $ | 214,610 | |
| Net income | | | — | | | | — | | | | — | | | | 38,609 | | | | — | | | | 38,609 | |
| Dividends paid | | | — | | | | — | | | | — | | | | (27,026 | ) | | | — | | | | (27,026 | ) |
| Adjustment for pension and postretirement benefit liability, net of tax of ($176) | | | — | | | | — | | | | — | | | | — | | | | 541 | | | | 541 | |
| Adjustment for interest rate swap, net of tax of ($3,140) | | | — | | | | — | | | | — | | | | — | | | | 9,640 | | | | 9,640 | |
| Repurchase of common stock | | | (171,088 | ) | | | (2 | ) | | | (5,999 | ) | | | — | | | | — | | | | (6,001 | ) |
| Stock based compensation | | | 76,930 | | | | 1 | | | | 6,728 | | | | — | | | | — | | | | 6,729 | |
| Balance at December 31, 2022 | | | 22,886,793 | | | $ | 229 | | | $ | 164,281 | | | $ | 63,464 | | | $ | 9,128 | | | $ | 237,102 | |
See accompanying Notes to Consolidated Financial Statements
DOUGLAS DYNAMICS, INC.
CONSOLIDATED STATEMENTS OF CASH FLOWS
(In Thousands)
| |
|
Years ended December 31, |
|
| |
|
2022 |
|
|
2021 |
|
|
2020 |
|
| Operating activities |
|
|
|
|
|
|
|
|
|
|
|
|
| Net income (loss) |
|
$ |
38,609 |
|
|
$ |
30,691 |
|
|
$ |
(86,553 |
) |
| Adjustments to reconcile net income (loss) to net cash provided by operating activities: |
|
|
|
|
|
|
|
|
|
|
|
|
| Depreciation and amortization |
|
|
20,938 |
|
|
|
20,316 |
|
|
|
19,737 |
|
| Amortization of deferred financing costs and debt discount |
|
|
491 |
|
|
|
894 |
|
|
|
1,364 |
|
| Debt modification expense |
|
|
- |
|
|
|
- |
|
|
|
267 |
|
| Loss on extinguishment of debt |
|
|
- |
|
|
|
4,936 |
|
|
|
- |
|
| Loss (gain) on disposal of fixed assets |
|
|
111 |
|
|
|
(220 |
) |
|
|
- |
|
| Stock-based compensation |
|
|
6,730 |
|
|
|
5,794 |
|
|
|
2,830 |
|
| Adjustments on derivatives not designated as hedges |
|
|
(688 |
) |
|
|
(1,192 |
) |
|
|
2,854 |
|
| Provision (credit) for losses on accounts receivable |
|
|
(1,476 |
) |
|
|
67 |
|
|
|
1,081 |
|
| Deferred income taxes |
|
|
(3,268 |
) |
|
|
1,618 |
|
|
|
(19,598 |
) |
| Impairment charges |
|
|
- |
|
|
|
1,211 |
|
|
|
127,872 |
|
| Non-cash lease expense |
|
|
1,030 |
|
|
|
1,768 |
|
|
|
4,182 |
|
| Earnout liability |
|
|
- |
|
|
|
- |
|
|
|
(2,017 |
) |
| Changes in operating assets and liabilities, net of acquisitions: |
|
|
|
|
|
|
|
|
|
|
|
|
| Accounts receivable |
|
|
(14,253 |
) |
|
|
12,093 |
|
|
|
3,038 |
|
| Inventories |
|
|
(32,483 |
) |
|
|
(24,276 |
) |
|
|
(1,801 |
) |
| Prepaid assets, refundable income taxes and other assets |
|
|
3,422 |
|
|
|
(1,714 |
) |
|
|
(3,715 |
) |
| Accounts payable |
|
|
21,522 |
|
|
|
10,418 |
|
|
|
(21 |
) |
| Accrued expenses and other current liabilities |
|
|
1,321 |
|
|
|
42 |
|
|
|
6,577 |
|
| Benefit obligations and other long-term liabilities |
|
|
(1,976 |
) |
|
|
(1,911 |
) |
|
|
(2,731 |
) |
| Net cash provided by operating activities |
|
|
40,030 |
|
|
|
60,535 |
|
|
|
53,366 |
|
| Investing activities |
|
|
|
|
|
|
|
|
|
|
|
|
| Capital expenditures |
|
|
(12,047 |
) |
|
|
(11,208 |
) |
|
|
(14,490 |
) |
| Net cash used in investing activities |
|
|
(12,047 |
) |
|
|
(11,208 |
) |
|
|
(14,490 |
) |
| Financing activities |
|
|
|
|
|
|
|
|
|
|
|
|
| Repurchase of common stock |
|
|
(6,001 |
) |
|
|
- |
|
|
|
- |
|
| Shares withheld on restricted stock vesting paid for employees’ taxes |
|
|
- |
|
|
|
- |
|
|
|
(72 |
) |
| Payments of financing costs |
|
|
- |
|
|
|
(1,371 |
) |
|
|
(1,133 |
) |
| Borrowings on long-term debt |
|
|
- |
|
|
|
224,438 |
|
|
|
270,875 |
|
| Dividends paid |
|
|
(27,026 |
) |
|
|
(26,522 |
) |
|
|
(25,926 |
) |
| Repayment of long-term debt |
|
|
(11,250 |
) |
|
|
(249,938 |
) |
|
|
(277,255 |
) |
| Net cash used in financing activities |
|
|
(44,277 |
) |
|
|
(53,393 |
) |
|
|
(33,511 |
) |
| Change in cash and cash equivalents |
|
|
(16,294 |
) |
|
|
(4,066 |
) |
|
|
5,365 |
|
| Cash and cash equivalents at beginning of year |
|
|
36,964 |
|
|
|
41,030 |
|
|
|
35,665 |
|
| Cash and cash equivalents at end of year |
|
$ |
20,670 |
|
|
$ |
36,964 |
|
|
$ |
41,030 |
|
| Non-cash operating and financing activities |
|
|
|
|
|
|
|
|
|
|
|
|
| Truck chassis inventory acquired through floorplan obligations |
|
$ |
4,725 |
|
|
$ |
34,432 |
|
|
$ |
38,167 |
|
| Supplemental disclosure of cash flow information |
|
|
|
|
|
|
|
|
|
|
|
|
| Income taxes paid |
|
$ |
7,025 |
|
|
$ |
9,768 |
|
|
$ |
4,279 |
|
| Interest paid |
|
$ |
11,662 |
|
|
$ |
12,307 |
|
|
$ |
16,841 |
|
See accompanying Notes to Consolidated Financial Statements
Notes to Consolidated Financial Statements
Years ended December 31, 2022, 2021 and 2020
(Dollars in Thousands Except Per Share Data)
1. Description of business and basis of presentation
Douglas Dynamics, Inc. (the “Company,”) is a premier manufacturer and upfitter of commercial vehicle attachments and equipment. The Company’s portfolio includes snow and ice management attachments sold under the BLIZZARD®, FISHER®, HENDERSON®, SNOWEX® and WESTERN® brands, turf care equipment under the TURFEX® brand, and industrial maintenance equipment under the SWEEPEX® brand. The Company’s portfolio also includes the upfit of market leading attachments and storage solutions under the HENDERSON® brand, and the DEJANA® brand and its related sub-brands. The Company is headquartered in Milwaukee, WI and currently owns manufacturing and upfit facilities in Milwaukee, WI, Manchester Iowa, Rockland, ME, Madison Heights, MI and Huntley, IL. The Company also leases fifteen manufacturing and upfit and service facilities located in Iowa, Maryland, Missouri, New Jersey, New York, Ohio, Pennsylvania, and Rhode Island. Additionally, the Company operates a sourcing office in China.
The Company conducts business in two segments: Work Truck Attachments and Work Truck Solutions. Financial information regarding these segments is in Note 17 to the Consolidated Financial Statements.
Recently adopted accounting standards
There were no accounting standards adopted in the year ended December 31, 2022.
2. Summary of Significant Accounting Policies
Principles of consolidation
The accompanying consolidated financial statements include the accounts of Douglas Dynamics, Inc. and its direct wholly‑owned subsidiary, Douglas Dynamics, L.L.C., and its wholly‑owned subsidiaries, Douglas Dynamics Finance Company (an inactive subsidiary), Fisher, LLC, Henderson Enterprises Group, Inc., Henderson Products, Inc. and Dejana Truck & Utility Equipment Company, LLC (hereinafter collectively referred to as the “Company”). All intercompany balances and transactions have been eliminated in consolidation.
Use of estimates
The preparation of the financial statements in conformity with U.S. generally accepted accounting principles requires management to make estimates and assumptions that affect the reported amounts of assets and liabilities and disclosure of contingent assets and liabilities at the date of the financial statements and the reported amounts of revenues and expenses during the reporting periods. Accordingly, actual results could differ from those estimates.
Cash and cash equivalents
The Company considers all highly liquid investments purchased with an original maturity of three months or less to be cash equivalents. Cash equivalents are carried at cost, which approximates fair value.
Notes to Consolidated Financial Statements (Continued)
Years ended
December 31, 2022,
2021 and
2020
(Dollars in Thousands Except Per Share Data)
Accounts receivable and allowance for credit losses
Effective January 1, 2020, the Company adopted new accounting guidance that significantly changes the impairment model for estimating credit losses on financial assets to a current expected credit losses (“CECL”) model that requires entities to estimate the lifetime expected credit losses on such assets, leading to earlier recognition of such losses. Under the new guidance, the Company is required to measure expected credit losses using forward-looking information to assess its allowance for credit losses. The guidance also requires the Company to consider of a broader range of reasonable and supportable information in estimating credit losses. The measurement of expected credit losses is based on relevant information about past events, including historical experience, current conditions, and reasonable and supportable forecasts that affect the collectability of the reported amount. Effective January 1, 2020, the adoption of CECL accounting, through a modified-retrospective approach, caused an increase to the allowance for credit losses of approximately $400 and $350 for the Work Truck Attachments and Work Truck Solutions segments, respectively.
The Company carries its accounts receivable at their face amount less an allowance for credit losses. The majority of the Company’s accounts receivable are due from distributors of truck equipment and dealers of completed upfit trucks. Credit is extended based on an evaluation of a customer’s financial condition. A receivable is considered past due if payments have not been received within agreed upon invoice terms. Accounts receivable are written off after all collection efforts have been exhausted. The Company takes a security interest in the inventory as collateral for the receivable but often does not have a priority security interest. The Company has short-term accounts receivable at its Work Truck Attachments and Work Truck Solutions segments subject to evaluation for expected credit losses. Expected credit losses are estimated based on the loss-rate and probability of default methods. On a periodic basis, the Company evaluates its accounts receivable and establishes the allowance for credit losses based on specific customer circumstances, past events including collections and write-off history, current conditions, and reasonable forecasts about the future. Management evaluated the need for an additional allowance for credit losses related to economic conditions arising from the COVID-19 pandemic. Management has not seen indications of customers going out of business and not being able to pay their bills (although the receivables may become more aged). Management believes customers of the Work Truck Attachments segment have long-standing relationships with the Company, and are mature dealers that are likely able to weather the pandemic and related macroeconomic challenges. Many Work Truck Solutions customers are governments and municipal entities who management believes are highly unlikely to default. In addition management believes Work Truck Solutions has long-standing relationships with its customers, and the customers are in general mature dealers that are unlikely to default as a result of the pandemic and its lingering effects. Therefore, as of December 31, 2022 and 2021, no additional reserve related to the COVID-19 pandemic was deemed necessary. As of December 31, 2022 the Company had an allowance for credit losses on its trade accounts receivable of $1,000 and $366 at its Work Truck Attachments and Work Truck Solutions segments, respectively. As of December 31, 2021 the Company had an allowance for credit losses on its trade accounts receivable of $1,430 and $1,540 at its Work Truck Attachments and Work Truck Solutions segments, respectively.
F-
11
Notes to Consolidated Financial Statements (Continued)
Years ended
December 31, 2022,
2021 and
2020
(Dollars in Thousands Except Per Share Data)
The following table rolls forward the activity related to credit losses for trade accounts receivable at each segment, and on a consolidated basis for the years ended December 31, 2022 and 2021:
| | | Balance at | | | Additions (reductions) | | | | | | | | | | | Balance at | |
| | | December 31, | | | charged to | | | | | | | Changes to | | | December 31, | |
| | | 2021 | | | earnings | | | Writeoffs | | | reserve, net | | | 2022 | |
| Year Ended December 31, 2022 | | | | | | | | | | | | | | | | | | | | |
| Work Truck Attachments | | $ | 1,430 | | | $ | (432 | ) | | $ | - | | | $ | 2 | | | $ | 1,000 | |
| Work Truck Solutions | | | 1,540 | | | | (1,044 | ) | | | (109 | ) | | | (21 | ) | | | 366 | |
| Total | | $ | 2,970 | | | $ | (1,476 | ) | | $ | (109 | ) | | $ | (19 | ) | | $ | 1,366 | |
| | | Balance at | | | Additions (reductions) | | | | | | | | | | | Balance at | |
| | | December 31, | | | charged to | | | | | | | Changes to | | | December 31, | |
| | | 2020 | | | earnings | | | Writeoffs | | | reserve, net | | | 2021 | |
| Year Ended December 31, 2021 | | | | | | | | | | | | | | | | | | | | |
| Work Truck Attachments | | $ | 1,480 | | | $ | (60 | ) | | $ | - | | | $ | 10 | | | $ | 1,430 | |
| Work Truck Solutions | | | 1,449 | | | | 127 | | | | (10 | ) | | | (26 | ) | | | 1,540 | |
| Total | | $ | 2,929 | | | $ | 67 | | | $ | (10 | ) | | $ | (16 | ) | | $ | 2,970 | |
Financing program
The Company is party to a financing program in which certain distributors may elect to finance their purchases from the Company through a third party financing company. The Company provides the third party financing company recourse against the Company regarding the collectability of the receivable under the program due to the fact that if the third party financing company is unable to collect from the distributor the amounts due in respect of the product financed, the Company would be obligated to repurchase any remaining inventory related to the product financed and reimburse any legal fees incurred by the financing company. During the years ended December 31, 2022, 2021 and 2020, distributors financed purchases of $15,782, $10,524 and $7,628 through this financing program, respectively. At both December 31, 2022 and December 31, 2021, there were no uncollectible outstanding receivables related to sales financed under the financing program. The amount owed by distributors to the third party financing company under this program at December 31, 2022 and 2021 was $16,089 and $8,281, respectively. The Company was not required to repurchase any repossessed inventory for the years ended December 31, 2022, 2021 and 2020.
In the past, minimal losses have been incurred under this agreement. However, an adverse change in distributor retail sales could cause this situation to change and thereby require the Company to repurchase repossessed units. Any repossessed units are inspected to ensure they are current, unused product and are restocked and resold.
Interest Rate Swap
The Company is a counterparty to interest rate swap agreements to hedge against the potential impact on earnings from increases in market interest rates. On June 13, 2019 the Company entered into an interest rate swap agreement to reduce its exposure to interest rate volatility. The interest rate swap has a notional amount of $175,000 effective for the period May 31, 2019 through May 31, 2024. The Company may have counterparty credit risk resulting from the interest rate swap, which it monitors on an on-going basis. The risk lies with one global financial institution. Under the interest rate swap agreement, the Company will either receive or make payments on a monthly basis based on the differential between 2.495% and LIBOR. From June 13, 2019 through March 18, 2020, the interest rate swap was accounted for as a cash flow hedge. During the first quarter of 2020, the swap was determined to be ineffective. As a result, the swap was dedesignated on March 19, 2020, and the remaining losses included in Accumulated other comprehensive income (loss) on the Consolidated Balance Sheets would be amortized into interest expense on a straight line basis through the life of the swap. The amount amortized from Accumulated other comprehensive income (loss) into earnings during the years ended December 31, 2022 and 2021 was ($1,163) and $568, respectively. A mark-to-market adjustment of $476 and ($1,760) was recorded as Interest expense in the Consolidated Statements of Income (Loss) for the years ended December 31, 2022 and 2021, respectively, related to the swap.
Notes to Consolidated Financial Statements (Continued)
Years ended
December 31, 2022,
2021 and
2020
(Dollars in Thousands Except Per Share Data)
On June 9, 2021, in conjunction with entering into the Credit Agreement described below, the Company re-designated its swap. As a result, the swap will be recorded at fair value with changes recorded in Accumulated other comprehensive income (loss). The amortization from Accumulated other comprehensive income into earnings from the previous dedesignation has been adjusted as of June 9, 2021 to include the de-recognition of previously recognized mark-to-market gains and the amortization of the off-market component as of the re-designation date, and will continue to be recognized through the life of the swap. The amount expected to be amortized from Accumulated other comprehensive loss into earnings in the next twelve months is $687.
On May 19, 2022, the Company entered into an interest rate swap agreement to further reduce its exposure to interest rate volatility. The interest rate swap has a notional amount of $125,000 effective for the period May 31, 2024 through June 9, 2026. The Company may have counterparty credit risk resulting from the interest rate swap, which it monitors on an on-going basis. The risk lies with two global financial institutions. Under the interest rate swap agreement, the Company will either receive or make payments on a monthly basis based on the differential between 2.718% and SOFR. The interest rate swap is accounted for as a cash flow hedge
The fair value of the interest rate swaps, net of tax, is $5,208 and ($4,756) at December 31, 2022 and December 31, 2021, respectively, of which $6,115 and ($3,524) is included in Accumulated other comprehensive income (loss) on the balance sheet as of December 31, 2022 and 2021, respectively. This fair value was determined using Level 2 inputs as defined in Accounting Standards Codification Topic (“ASC”) 820 - Fair Value Measurements and Disclosures.
Inventories
Inventories are stated at the lower of cost or market. Market is determined based on estimated realizable values. Inventory costs are primarily determined by the first‑in, first‑out (FIFO) method. The Company periodically reviews its inventory for slow moving, damaged and discontinued items and provides reserves to reduce such items identified to their recoverable amounts.
The Company records inventories to include truck chassis inventory financed through a floor plan financing agreement as discussed in Note 9. The Company takes title to truck chassis upon receipt of the inventory through its floor plan agreement and performs upfitting service installations to the truck chassis inventory during the installation period. The floor plan obligation is then assumed by the dealer customer upon delivery. At December 31, 2022 and 2021, the Company had $1,211 and $2,655 of chassis inventory and related floor plan financing obligation, respectively. The Company recognizes revenue associated with upfitting and service installations net of the truck chassis.
The Company receives, on consignment, truck chassis on which it performs upfitting service installations under “bailment pool” arrangements with major truck manufacturers. The Company never receives title to the truck chassis. The aggregate value of all bailment pool chassis on hand as of December 31, 2022 and 2021 was $7,847 and $8,439, respectively. The Company is responsible to the manufacturer for interest on chassis held for upfitting. The Company recognizes revenue associated with upfitting and service installations net of the truck chassis.
Leases
As of December 31, 2022, sixteen of the Company’s office and upfit and distribution centers were subject to a lease agreement. See Note 7 for additional information on the Company’s leases.
In the year ended December 31, 2021, it was determined that facility leases related to two locations in our Work Truck Solutions segment were impaired. As a result, an impairment of $1,211 was recorded in the year ended December 31, 2021 and is recorded under Impairment charges in the Company’s Consolidated Statements of Income (Loss), with an offset being a reduction to the Operating lease - right of use asset on our Consolidated Balance Sheets. See Note 7 for additional information.
Notes to Consolidated Financial Statements (Continued)
Years ended
December 31, 2022,
2021 and
2020
(Dollars in Thousands Except Per Share Data)
Property, plant and equipment
Property, plant and equipment are recorded at cost, less accumulated depreciation. Depreciation is computed using straight‑line methods over the estimated useful lives for financial statement purposes and an accelerated method for income tax reporting purposes. The estimated useful lives of the assets are as follows:
| | | Years | |
| Land improvements and buildings | | 15 - 40 | |
| Leasehold improvements | | 12 | |
| Machinery and equipment | | 3 - 20 | |
| Furniture and fixtures | | 3 - 12 | |
| Mobile equipment and other | | 3 - 10 | |
Depreciation expense was $10,418, $9,634, and $8,806 for the years ended December 31, 2022, 2021 and 2020, respectively. The estimated useful lives of leasehold improvements is the shorter of the remainder of the lease term and twelve years.
Expenditures for renewals and improvements that significantly add to the productive capacity or extend the useful life of an asset are capitalized. Expenditures for maintenance and repairs are charged to operations when incurred. Repairs and maintenance expenses amounted to $6,750, $5,974 and $6,089 for the years ended December 31, 2022, 2021 and 2020, respectively. When assets are sold or retired, the cost of the asset and the related accumulated depreciation are eliminated from the accounts and any gain or loss is recognized in results of operations.
Impairment of long‑lived assets
Long‑lived assets are reviewed for potential impairment when events or changes in circumstances indicate that the carrying amount of the asset may not be recoverable. Recoverability of assets to be held and used is measured by comparison of the carrying value of such assets to the undiscounted future cash flows expected to be generated by the assets. If the carrying value of an asset exceeds its estimated undiscounted future cash flows, an impairment provision is recognized to the extent that the carrying amount of the asset exceeds its fair value. Assets to be disposed of are reported at the lower of the carrying amount or the fair value of the asset, less costs of disposition. Management of the Company considers such factors as current results, trends and future prospects, current market value, and other economic and regulatory factors in performing these analyses. The Company determined that no long-lived assets were impaired as of December 31, 2022.
In the year ended December 31, 2021, it was determined that facility leases related to two locations in the Company's Work Truck Solutions segment were impaired. As a result, an impairment of $1.2 million was recorded in the year ended December 31, 2021 and is recorded under Impairment charges in the Company’s Consolidated Statements of Income (Loss), with an offset being a reduction to the Operating lease - right of use asset on the Company's Consolidated Balance Sheets. See Note 7 for additional information.
Notes to Consolidated Financial Statements (Continued)
Years ended
December 31, 2022,
2021 and
2020
(Dollars in Thousands Except Per Share Data)
Goodwill and other intangible assets
Goodwill and indefinite‑lived intangible assets are tested for impairment annually as of December 31, or sooner if impairment indicators arise. The fair value of indefinite-lived intangible assets is estimated based upon an income and market approach. In reviewing goodwill for impairment, potential impairment is identified by comparing the estimated fair value of the reporting units to its carrying value. The Company has determined it has four reporting units. When the fair value is less than the carrying value of the net assets of the reporting unit, including goodwill, an impairment loss would be recognized. Annual impairment tests conducted by the Company on December 31, 2022 and December 31, 2021 resulted in no adjustment to the carrying value of goodwill. During the second quarter of 2020, the Company identified a triggering event as there had been a significant decline in the business climate and in results of operations as a result of uncertainty related to the COVID-19 pandemic and chassis availability. Given these indicators, the Company determined that there was a higher degree of uncertainty in achieving its financial projections. Therefore, the Company performed an impairment test as of June 30, 2020 for each of its reporting units, and subsequently performed its annual impairment testing as of December 31, 2020.
The Work Truck Attachments segment consists of two reporting units: Commercial Snow & Ice and Douglas Dynamics Vertical Integration. Only the Commercial Snow & Ice reporting unit has goodwill. The impairment tests performed as of June 30, 2020 and December 31, 2020 indicated no impairment for the Commercial Snow & Ice reporting unit, which had goodwill of $113,132 at both December 31, 2022 and 2021. The Work Truck Solutions consists of two reporting units; Municipal and Dejana. At June 30, 2020, the Municipal reporting unit’s carrying value exceeded its fair value. As a result, all $47,799 of the Municipal goodwill balance was recorded as an impairment charge during year ended December 31, 2020 and is included in Impairment charges on the Consolidated Statements of Income (Loss). At June 30, 2020, the Dejana reporting unit’s carrying value exceeded its fair value. As a result, all $80,073 of the Dejana goodwill balance was recorded as an impairment charge during the year ended December 31, 2020 and is included in Impairment charges on the Consolidated Statements of Income (Loss).
Intangible assets with estimable useful lives are amortized over their respective estimated useful lives and are reviewed for potential impairment when events or circumstances indicate that the carrying amount of the asset may not be recoverable. The Company amortizes its distribution network intangibles over periods ranging from 15 to 20 years, trademarks over 7 to 25 years, patents over 7 to 20 years, customer relationships over 15 to 19.5 years and noncompete agreements over 4 to 5 years. There were no indicators of impairment during the years ended December 31, 2022 or 2021. The Company had gross intangible assets and accumulated amortization of $273,755 and $142,166, respectively, for the year ended December 31, 2022, of which $177,765 and $104,196 relate to the Work Truck Attachments segment, and $95,990 and $37,970 relate to the Work Truck Solutions segment, respectively. The Company had gross intangible assets and accumulated amortization of $273,755 and $131,646, respectively for the year ended December 31, 2021, of which $177,765 and $98,803 relate to the Work Truck Attachments segment, and $95,990 and $32,843 relate to the Work Truck Solutions segment, respectively.
At December 31, 2022, the Company’s Dejana reporting unit had tradenames of $14,000 and an estimated fair value of $17,100. If the Company is unable to attain the financial projections used in calculating the fair value, or if there are significant market conditions impacting the market approach, the Company’s Dejana tradenames could be at risk of impairment. If the Company experiences further delays by its supplier and OEM partners in the production and delivery of chassis for a prolonged period of time, which could negatively affect the Company’s financial results, the Dejana tradenames may be impaired. The discount rate and royalty rate used in the calculation of the fair value are sensitive and based on the Company’s assumptions, and changes to those assumptions could cause the Dejana tradenames to be at risk of impairment. There were no indicators of impairment subsequent to the December 31, 2022 impairment test.
Notes to Consolidated Financial Statements (Continued)
Years ended
December 31, 2022,
2021 and
2020
(Dollars in Thousands Except Per Share Data)
Income taxes
Deferred income taxes are accounted for under the asset and liability method whereby deferred tax assets and liabilities are recognized for the future tax consequences attributable to differences between the financial statement carrying amounts of existing assets and liabilities and their respective tax bases. Deferred tax assets and liabilities are measured using enacted tax rates. Deferred income tax provisions or benefits are based on the change in the deferred tax assets and liabilities from period to period. Deferred income tax assets are reduced by a valuation allowance if it is more likely than not that some portion of the deferred income tax asset will not be realized. Additionally, when applicable, the Company would classify interest and penalties related to uncertain tax positions in income tax expense.
Deferred financing costs
The costs of obtaining financing are capitalized and amortized over the term of the related financing on a basis that approximates the effective interest method. The changes in deferred financing costs are as follows:
| Balance at December 31, 2019 | | $ | 1,563 | |
| Deferred financing costs capitalized on new debt | | | 1,133 | |
| Write-off of unamortized deferred financing costs | | | (197 | ) |
| Amortization of deferred financing costs | | | (763 | ) |
| Balance at December 31, 2020 | | | 1,736 | |
| Deferred financing costs capitalized on new debt | | | 1,409 | |
| Write-off of unamortized deferred financing costs | | | (972 | ) |
| Amortization of deferred financing costs | | | (493 | ) |
| Balance at December 31, 2021 | | | 1,680 | |
| Amortization of deferred financing costs | | | (379 | ) |
| Balance at December 31, 2022 | | $ | 1,301 | |
Fair value
Fair value is the price at which an asset could be exchanged in a current transaction between knowledgeable, willing parties. A liability’s fair value is defined as the amount that would be paid to transfer the liability to a new obligor, not the amount that would be paid to settle the liability with the creditor. Fair value measurements are categorized into one of three levels based on the lowest level of significant input used: Level 1 (unadjusted quoted prices in active markets); Level 2 (observable market inputs available at the measurement date, other than quoted prices included in Level 1); and Level 3 (unobservable inputs that cannot be corroborated by observable market data).
Notes to Consolidated Financial Statements (Continued)
Years ended
December 31, 2022,
2021 and
2020
(Dollars in Thousands Except Per Share Data)
The following table presents financial assets and liabilities measured at fair value on a recurring basis and discloses the fair value of long‑term debt:
| | | Fair Value at December 31, 2022 | | | Fair Value at December 31, 2021 | |
| Assets: | | | | | | | | |
| Non-qualified benefit plan assets (a) | | $ | 8,874 | | | $ | 10,347 | |
| Interest rate swaps (b) | | | 7,039 | | | | - | |
| | | | | | | | | |
| Total Assets | | $ | 15,913 | | | $ | 10,347 | |
| | | | | | | | | |
| Liabilities: | | | | | | | | |
| Interest rate swaps (b) | | | - | | | | 6,428 | |
| Long term debt (c) | | | 207,737 | | | | 218,875 | |
| | | | | | | | | |
| Total Liabilities | | $ | 207,737 | | | $ | 225,303 | |
| | (a) | Included in Non-qualified benefit plan assets is the cash surrender value of insurance policies on various individuals that are associated with the Company. The carrying amounts of these insurance policies approximates their fair value. |
| | (b) | Valuation models are calibrated to initial trade price. Subsequent valuations are based on observable inputs to the valuation model (e.g. interest rates and credit spreads). Model inputs are changed only when corroborated by market data. A credit risk adjustment is made on each swap using observable market credit spreads. Thus, inputs used to determine fair value of the interest rate swap are Level 2 inputs. Interest rate swaps of $4,120 and $2,919 at December 31, 2022 are included in Prepaid and other current assets and Other long-term assets, respectively. Interest rate swaps of $3,479 and $2,949 at December 31, 2021 are included in Accrued expenses and other current liabilities and Other long-term liabilities, respectively. |
| | (c) | The fair value of the Company’s long‑term debt, including current maturities, is based on rates for instruments with comparable maturities and credit quality (Level 2 inputs), and approximates its carrying value. Long‑term debt is recorded at carrying amount, net of discount and deferred financing costs, as disclosed on the face of the balance sheet. |
Concentration of credit risk
The Company’s cash is deposited with multiple financial institutions. At times, deposits in these institutions exceed the amount of insurance provided on such deposits. The Company has not experienced any losses in such accounts and believes that it is not exposed to any significant risk on these balances.
No distributor represented more than 10% of the Company’s net sales or accounts receivable during the years ended December 31, 2022, 2021 and 2020.
Notes to Consolidated Financial Statements (Continued)
Years ended
December 31, 2022,
2021 and
2020
(Dollars in Thousands Except Per Share Data)
Revenue recognition
The Company applies the guidance codified in Accounting Standards Codification 606, Revenue from Contracts with Customers (“Topic 606”) using the modified retrospective method upon the adoption of ASU 2014-09 in 2018. Revenue is recognized when or as the Company satisfies a performance obligation. See Note 3 for a more detailed description of revenue recognition policies.
Cost of sales
Cost of sales includes all costs associated with the manufacture of the Company’s products, including raw materials, purchased parts, freight, plant operating expenses, property insurance and taxes, and plant depreciation. All payroll costs and employee benefits for the hourly workforce, manufacturing management, and engineering costs are included in cost of sales.
Related party transactions
There were no related party transactions during 2020, 2021 or 2022.
Warranty cost recognition
The Company accrues for estimated warranty costs as revenue is recognized. All warranties are assurance-type warranties. See Note 11 for further details.
Defined benefit plans
The Company has noncontributory, defined benefit postretirement benefit plans covering certain employees. Management reviews underlying assumptions on an annual basis. Refer to Note 13 for additional information.
Advertising expenses
Advertising expenses include costs for the production of marketing media, literature, website content and displays. The Company participates in trade shows and advertises in the yellow pages and billboards. Advertising expenses amounted to $4,699, $3,884 and $3,437 for the years ended December 31, 2022, 2021 and 2020, respectively. All costs associated with the Company’s advertising programs are expensed as incurred.
Research and development expenses
Research and development expenses include costs to develop new technologies to enhance existing products and to expand the range of product offerings. Research and development expenses amounted to $12,159, $10,152 and $6,679 for the years ended December 31, 2022, 2021 and 2020, respectively.
Notes to Consolidated Financial Statements (Continued)
Years ended
December 31, 2022,
2021 and
2020
(Dollars in Thousands Except Per Share Data)
Shipping and handling costs
Generally, shipping and handling costs are paid directly by the customer to the shipping agent. Those shipping and handling costs billed by the Company are recorded as a component of sales with the corresponding costs included in cost of sales.
Share‑based payments
The Company applies the guidance codified in ASC 718, Compensation—Stock Compensation. This standard requires the measurement of the cost of employee services received in exchange for an award of equity instruments based on the fair value of the award at the grant date and recognition of the compensation expense over the period during which an employee is required to provide service in exchange for the award (generally the vesting period).
Accumulated other comprehensive income (loss)
Accumulated other comprehensive income (loss) is defined as the change in equity (net assets) of a business enterprise during a period from transactions and other events and circumstances from non‑owner resources and is comprised of net income or loss and “other comprehensive income (loss)”. The Company’s other comprehensive income (loss) is comprised of the adjustments for postretirement benefit liabilities as well as the impact of its interest rate swaps. See Note 20 for the components of accumulated other comprehensive income (loss).
Segment reporting
The Company operates through two operating segments for which separate financial information is available, and for which operating results are evaluated regularly by the Company's chief operating decision maker in determining resource allocation and assessing performance. The Company’s two current reportable business segments are described below.
Work Truck Attachments. The Work Truck Attachments segment includes our operations that manufacture and sell snow and ice control attachments and other products sold under the FISHER®, WESTERN® and SNOWEX® brands, as well as our vertically integrated products.
Work Truck Solutions. The Work Truck Solutions segment includes manufactured municipal snow and ice control products under the HENDERSON® brand and the up-fit of market leading attachments and storage solutions under the HENDERSON® brand, and the DEJANA® brand and its related sub-brands.
Segment performance is evaluated based on segment net sales and Adjusted EBITDA. See Note 17 for financial information regarding these segments. Sales are primarily within the United States and substantially all assets are located within the United States.
Notes to Consolidated Financial Statements (Continued)
Years ended
December 31, 2022,
2021 and
2020
(Dollars in Thousands Except Per Share Data)
3. Revenue Recognition
Revenue Streams
The following is a description of principal activities from which the Company generates revenue. Revenues are recognized when control of the promised goods or services are transferred to the customer, in an amount that reflects the consideration that the Company expects to receive in exchange for those goods or services. The Company generates all of its revenue from contracts with customers. Additionally, contract amounts represent the full amount of the transaction price as agreed upon with the customer at the time of order, resulting in a single performance obligation in all cases. In the case of a single order containing multiple upfits, the transaction price may represent multiple performance obligations.
Work Truck Attachments
The Company recognizes revenue upon shipment of equipment to the customer. Within the Work Truck Attachments segment, the Company offers a variety of discounts and sales incentives to its distributors. The estimated liability for sales discounts and allowances is calculated using the expected value method and recorded at the time of sale as a reduction of net sales. The liability is estimated based on the costs of the program, the planned duration of the program and historical experience.
The Work Truck Attachments segment has two revenue streams, as identified below.
Independent Dealer Sales – Revenues from sales to independent dealers are recognized when the customer obtains control of the Company’s product, which occurs at a point in time, typically upon shipment. In these instances, each product is considered a separate performance obligation, and revenue is recognized upon shipment of the goods. Any shipping and handling activities performed by the Company after the transfer of control to the customer (e.g., when control transfers upon shipment) are considered fulfillment activities, and accordingly, the costs are accrued for when the related revenue is recognized.
Parts & Accessory Sales – The Company’s equipment is used in harsh conditions and parts frequently wear out. These parts drive recurring revenues through parts and accessory sales. The process for recording parts and accessory sales is consistent with the independent dealer sales noted above.
Work Truck Solutions
The Work Truck Solutions segment primarily participates in the truck and vehicle upfitting industry in the United States. Customers are billed separately for the truck chassis by the chassis manufacturer. The Company only records sales for the amount of the upfit, excluding the truck chassis. Generally, the Company obtains the truck chassis from the truck chassis manufacturer through either its floor plan agreement with a financial institution or bailment pool agreement with the truck chassis manufacturer. Additionally, in some instances the Company upfits chassis which are owned by the end customer. For truck chassis acquired through the floor plan agreement, the Company holds title to the vehicle from the time the chassis is received by the Company until the completion of the up-fit. Under the bailment pool agreement, the Company does not take title to the truck chassis, but rather only holds the truck chassis on consignment. The Company pays interest on both of these arrangements. The Company records revenue in the same manner net of the value of the truck chassis in both the Company’s floor plan and bailment pool agreements. The Company does not set the price for the truck chassis, is not responsible for the billing of the chassis and does not have inventory risk in either the bailment pool or floor plan agreements. The Work Truck Solutions segment also has manufacturing operations of municipal snow and ice control equipment, where revenue is recognized upon shipment of equipment to the customer.
Revenues from the sales of the Work Truck Solutions products are recognized net of the truck chassis with the selling price to the customer recorded as sales and the manufacturing and up-fit cost of the product recorded as cost of sales. In these cases, the Company acts as an agent as it does not have inventory or pricing control over the truck chassis. Within the Work Truck Solutions segment, the Company also sells certain third-party products for which it acts as an agent. These sales do not meet the criteria for gross sales recognition, and thus are recognized on a net basis at the time of sale. Under net sales recognition, the cost paid to the third-party service provider is recorded as a reduction to sales, resulting in net sales being equal to the gross profit on the transaction.
Notes to Consolidated Financial Statements (Continued)
Years ended
December 31, 2022,
2021 and
2020
(Dollars in Thousands Except Per Share Data)
The Work Truck Solutions segment has four revenue streams, as identified below.
State and Local Bids – The Company records revenue of separately sold snow and ice equipment upon shipment and fully upfit vehicles upon delivery. The state and local bid process does not obligate the entity to buy any products from the Company, but merely allows the entity to purchase products in the future typically for a fixed period of time. The entity commits to actually purchasing products from the Company when it issues purchase orders off of a previously awarded bid, which lists out actual quantities of equipment being ordered and the delivery terms. On upfit transactions, the Company is providing a significant service by assembling and integrating the individual products onto the customer’s truck. Each individual product and installation activity is highly interdependent and highly interrelated, and therefore the Company considers the manufacture and upfit of a truck a single performance obligation. Any shipping and handling activities performed by the Company after the transfer of control to the Customer (e.g., when control transfers upon shipment) are considered fulfillment activities, and accordingly, the costs are accrued for when the related revenue is recognized.
Fleet Upfit Sales – The Company enters into contracts with certain fleet customers. Fleet agreements create enforceable rights without the issuance of a purchase order. Typically these agreements outline the terms of sale, payment terms, standard pricing, and the rights of the customer and seller. Fleet sales are performed on both customer owned vehicles as well as non-customer owned vehicles. For non-customer owned vehicles, revenue is recognized at a point in time upon delivery of the truck to the customer. For customer-owned vehicles, per Topic 606, revenue is recognized over time based on a cost input method. The Company accumulates costs incurred on partially completed customer-owned upfits based on estimated margin and completion. This change to over time recognition for customer owned vehicles decreased revenue by $136, increased revenue by $373 and decreased revenue by $542 for the years ended December 31, 2022, 2021 and 2020, respectively.
Dealer Upfit Sales – The Company upfits work trucks for independent dealer customers. Dealer upfit revenue is recorded upon delivery. The customer does not own the vehicles during the upfit process, and as such revenue is recorded at a point in time upon delivery to the customer.
Over the Counter / Parts & Accessory Sales – Work Truck Solutions part and accessory sales are recorded as revenue upon shipment. Additionally, customers can purchase parts at any of the Company’s showrooms. In these instances, each product is considered a separate performance obligation, and revenue is recognized upon shipment of the goods or customer pick up.
Notes to Consolidated Financial Statements (Continued)
Years ended
December 31, 2022,
2021 and
2020
(Dollars in Thousands Except Per Share Data)
Disaggregation of Revenue
The following table provides information about disaggregated revenue by customer type and timing of revenue recognition, and includes a reconciliation of the disaggregated revenue with reportable segments.
Revenue by customer type was as follows:
| Year Ended December 31, 2022 | | Work Truck Attachments | | | Work Truck Solutions | | | Total Revenue | |
| Independent dealer | | $ | 382,296 | | | $ | 119,900 | | | $ | 502,196 | |
| Government | | | - | | | | 56,319 | | | | 56,319 | |
| Fleet | | | - | | | | 49,094 | | | | 49,094 | |
| Other | | | - | | | | 8,459 | | | | 8,459 | |
| Total revenue | | $ | 382,296 | | | $ | 233,772 | | | $ | 616,068 | |
| Year Ended December 31, 2021 | | Work Truck Attachments | | | Work Truck Solutions | | | Total Revenue | |
| Independent dealer | | $ | 325,707 | | | $ | 121,349 | | | $ | 447,056 | |
| Government | | | - | | | | 46,107 | | | | 46,107 | |
| Fleet | | | - | | | | 38,669 | | | | 38,669 | |
| Other | | | - | | | | 9,621 | | | | 9,621 | |
| Total revenue | | $ | 325,707 | | | $ | 215,746 | | | $ | 541,453 | |
| Year Ended December 31, 2020 | | Work Truck Attachments | | | Work Truck Solutions | | | Total Revenue | |
| Independent dealer | | $ | 252,838 | | | $ | 114,192 | | | $ | 367,030 | |
| Government | | | - | | | | 62,762 | | | | 62,762 | |
| Fleet | | | - | | | | 42,590 | | | | 42,590 | |
| Other | | | - | | | | 7,772 | | | | 7,772 | |
| Total revenue | | $ | 252,838 | | | $ | 227,316 | | | $ | 480,154 | |
Revenue by timing of revenue recognition was as follows:
| Year Ended December 31, 2022 | | Work Truck Attachments | | | Work Truck Solutions | | | Total Revenue | |
| Point in time | | $ | 382,296 | | | $ | 145,022 | | | $ | 527,318 | |
| Over time | | | - | | | | 88,750 | | | | 88,750 | |
| Total revenue | | $ | 382,296 | | | $ | 233,772 | | | $ | 616,068 | |
| Year Ended December 31, 2021 | | Work Truck Attachments | | | Work Truck Solutions | | | Total Revenue | |
| Point in time | | $ | 325,707 | | | $ | 137,904 | | | $ | 463,611 | |
| Over time | | | - | | | | 77,842 | | | | 77,842 | |
| Total revenue | | $ | 325,707 | | | $ | 215,746 | | | $ | 541,453 | |
Notes to Consolidated Financial Statements (Continued)
Years ended
December 31, 2022,
2021 and
2020
(Dollars in Thousands Except Per Share Data)
| Year Ended December 31, 2020 | | Work Truck Attachments | | | Work Truck Solutions | | | Total Revenue | |
| Point in time | | $ | 252,838 | | | $ | 149,675 | | | $ | 402,513 | |
| Over time | | | - | | | | 77,641 | | | | 77,641 | |
| Total revenue | | $ | 252,838 | | | $ | 227,316 | | | $ | 480,154 | |
Contract Balances
The following table shows the changes in the Company’s contract liabilities during the years ended December 31, 2022 and 2021:
| Year Ended December 31, 2022 | | Balance at Beginning of Period | | | Additions | | | Deductions | | | Balance at End of Period | |
| Contract liabilities | | $ | 2,454 | | | $ | 20,511 | | | $ | (18,434 | ) | | $ | 4,531 | |
| Year Ended December 31, 2021 | | Balance at Beginning of Period | | | Additions | | | Deductions | | | Balance at End of Period | |
| Contract liabilities | | $ | 2,746 | | | $ | 17,205 | | | $ | (17,497 | ) | | $ | 2,454 | |
The Company receives payments from customers based upon contractual billing schedules. Contract assets include amounts related to our contractual right to consideration for completed performance obligations not yet invoiced. There were no contract assets as of December 31, 2022 or 2021. Contract liabilities include payments received in advance of performance under the contract, variable freight allowances which are refunded to the customer, and rebates paid to distributors under the Company’s municipal rebate program, and are realized with the associated revenue recognized under the contract.
The Company recognized all of the amount that was included in contract liabilities at the beginning of the period as revenue in the years ended December 31, 2022 and 2021.
Practical Expedients and Exemptions
As allowed under Topic 606, the Company adopted the following practical expedients and exemptions:
| | ● | The Company generally expenses sales commissions when incurred because the amortization period would have been less than one year. The Company records these costs within selling, general and administrative expenses. |
| | ● | The Company does not disclose the value of unsatisfied performance obligations for (i) contracts with an original expected length of one year or less and (ii) contracts for which the Company recognizes revenue at the amount to which it has the right to invoice for services performed. |
| | ● | The Company does not assess whether promised goods or services are performance obligations if they are immaterial in the context of the contract with the customer. |
| | ● | The Company excludes from the transaction price all sales taxes that are assessed by a governmental authority. |
Notes to Consolidated Financial Statements (Continued)
Years ended
December 31, 2022,
2021 and
2020
(Dollars in Thousands Except Per Share Data)
| | ● | The Company does not adjust the promised amount of consideration for the effects of a significant financing component, as it expects at contract inception that the period between the transfer to a promised good or service to a customer and the customer’s payment for the good or service will be one year or less. |
| | ● | The Company accounts for shipping and handling activities that occur after control of the related good transfers as fulfillment activities instead of assessing such activities as performance obligations. |
4. Acquisitions
On July 15, 2016, the Company acquired Dejana. The Dejana purchase agreement includes contingent consideration in the form of an earnout capped at $26,000. Under the earnout agreement, the former owners of Dejana are entitled to receive payments contingent upon the revenue growth and financial performance of the acquired business for the years 2016, 2017 and 2018. The preliminary estimated fair value of the earnout consideration was $10,200 which was further adjusted at December 31, 2016 to $10,373 as a result of the 2016 performance exceeding the 2016 fair value established at the opening balance sheet by $173. Based on the year ended December 31, 2016 results, the new possible range of outcomes was reduced from $26,000 to a maximum earnout of $21,487. The Company made a payment to the former owners of Dejana of $5,487 in the year ended December 31, 2017. The purchase agreement was amended on September 20, 2017 to extend the earnout measurement periods for an additional two years, namely the fiscal years ended December 31, 2019 and December 31, 2020, with the potential for the former owners of Dejana to earn up to 50% of the remaining unearned earnout payments based on the original earnout targets and measurement periods. During the third quarter of 2017, there was a fair value adjustment to reduce the earnout by ($1,186), which was further reduced during the fourth quarter by ($600), for a total fair value adjustment to the earnout for the year of ($1,786). During the fourth quarter of 2018, there was a fair value adjustment to reduce the earnout by ($900). During the fourth quarter of 2019, there was a fair value adjustment to reduce the earnout by ($200). During the second quarter of 2020, there was a fair value adjustment to reduce the earnout by ($2,000), which is included as a reduction to selling, general and administrative expense in the Consolidated Statements of Income (Loss) for the year ended December 31, 2020 and which reduced the fair value of the earnout consideration to $0.
5. Inventories
Inventories consist of the following:
| |
|
December 31, |
|
| |
|
2022 |
|
|
2021 |
|
| |
|
|
|
|
|
|
|
|
| Finished goods |
|
$ |
67,006 |
|
|
$ |
50,416 |
|
| Work-in-process |
|
|
19,037 |
|
|
|
8,916 |
|
| Raw material and supplies |
|
|
50,458 |
|
|
|
44,687 |
|
| |
|
$ |
136,501 |
|
|
$ |
104,019 |
|
The inventories in the table above do not include truck chassis inventory financed through a floor plan financing agreement as discussed in Note 9. The Company takes title to truck chassis upon receipt of the inventory through its floor plan agreement and performs upfitting service installations to the truck chassis inventory during the installation period. The floor plan obligation is then assumed by the dealer customer upon delivery. At December 31, 2022 and 2021, the Company had $1,211 and $2,655 of chassis inventory and related floor plan financing obligation, respectively. The Company recognizes revenue associated with upfitting and service installations net of the truck chassis.
Notes to Consolidated Financial Statements (Continued)
Years ended
December 31, 2022,
2021 and
2020
(Dollars in Thousands Except Per Share Data)
Unlike the floorplan agreement, the Company does not record inventory related to truck chassis acquired through the bailment pool agreement as these truck chassis are held on consignment. Like the revenue recognized on floorplan arrangement, revenue recognized for upfitting services on chassis acquired through the bailment agreement, are also recognized net of the truck chassis.
6. Property, plant and equipment
Property, plant and equipment are summarized as follows:
| |
|
December 31, |
|
| |
|
2022 |
|
|
2021 |
|
| |
|
|
|
|
|
|
|
|
| Land |
|
$ |
3,969 |
|
|
$ |
3,969 |
|
| Land improvements |
|
|
5,431 |
|
|
|
5,278 |
|
| Leasehold improvements |
|
|
5,844 |
|
|
|
5,405 |
|
| Buildings |
|
|
35,858 |
|
|
|
34,635 |
|
| Machinery and equipment |
|
|
75,190 |
|
|
|
68,939 |
|
| Furniture and fixtures |
|
|
24,605 |
|
|
|
22,275 |
|
| Mobile equipment and other |
|
|
4,927 |
|
|
|
4,737 |
|
| Construction-in-process |
|
|
5,272 |
|
|
|
4,235 |
|
| Total property, plant and equipment |
|
|
161,096 |
|
|
|
149,473 |
|
| Less accumulated depreciation |
|
|
(92,436 |
) |
|
|
(82,686 |
) |
| Net property, plant and equipment |
|
$ |
68,660 |
|
|
$ |
66,787 |
|
Notes to Consolidated Financial Statements (Continued)
Years ended
December 31, 2022,
2021 and
2020
(Dollars in Thousands Except Per Share Data)
7. Leases
The Company has operating leases for manufacturing, upfit and office facilities, land and parking lots, warehousing space and certain equipment. The leases have remaining lease terms of less than one year to 14 years, some of which include options to extend the leases for up to 10 years. Such renewal options were not included in the determination of the lease term unless deemed reasonably certain of exercise. The discount rate used in measuring the lease liabilities is based on the Company’s interest rate on its secured Term Loan Credit Agreement. Certain of the Company’s leases contain escalating rental payments based on an index. The Company’s lease agreements do not contain any material residual value guarantees or material restrictive covenants.
In the year ended December 31, 2021, it was determined that facility leases related to two locations in the Company’s Work Truck Solutions segment were impaired. These two facilities are being significantly downsized as part of a restructuring plan, and so it was determined that the carrying value exceeded the fair value of the facilities. As a result, an impairment of $1,211 was recorded in the year ended December 31, 2021 and is recorded under Impairment charges in the Company’s Consolidated Statements of Income (Loss), with an offset being a reduction to the Operating lease - right of use asset on the Company’s Consolidated Balance Sheets. Going forward, the remaining balance of the right of use asset for the impaired leases will be amortized on a straight line basis. The lease liability for the impaired leases will continued to be amortized over the life of the lease.
As allowed under ASC 842, the Company has adopted the following practical expedients:
| |
● |
Short-term lease practical expedient |
| |
o |
Allows the Company not to apply the recognition requirements in ASC 842 to short-term leases for all asset classes. Short term leases are leases that, at commencement date, have a term of 12 months or less and do not include an option to purchase the underlying asset that the lessee is reasonably certain to exercise. |
| |
● |
Separating lease components practical expedient |
| |
o |
Allows the Company not to separate lease components from nonlease components for all asset classes and instead account for each separate lease and the nonlease components associated with that lease component as a single lease component. |
Lease Expense
The components of lease expense, which are included in Cost of sales and Selling, general and administrative expenses on the Consolidated Statements of Income (Loss), were as follows:
| |
|
Year Ended |
|
|
Year Ended |
|
|
Year Ended |
|
| |
|
December 31, 2022 |
|
|
December 31, 2021 |
|
|
December 31, 2020 |
|
| Operating lease expense |
|
$ |
5,555 |
|
|
$ |
5,663 |
|
|
$ |
5,343 |
|
| Short term lease cost |
|
$ |
395 |
|
|
$ |
278 |
|
|
$ |
397 |
|
| Total lease cost |
|
$ |
5,950 |
|
|
$ |
5,941 |
|
|
$ |
5,740 |
|
F-
26
Notes to Consolidated Financial Statements (Continued)
Years ended
December 31, 2022,
2021 and
2020
(Dollars in Thousands Except Per Share Data)
Cash Flow
Supplemental cash flow information related to leases is as follows:
| |
|
Year Ended |
|
|
Year Ended |
|
|
Year Ended |
|
| |
|
December 31, 2022 |
|
|
December 31, 2021 |
|
|
December 31, 2020 |
|
| |
|
|
|
|
|
|
|
|
|
|
|
|
| Cash paid for amounts included in the measurement of operating lease liabilities |
|
$ |
5,753 |
|
|
$ |
5,566 |
|
|
$ |
5,268 |
|
| Non-cash lease expense - right-of-use assets |
|
$ |
4,745 |
|
|
$ |
1,768 |
|
|
$ |
4,182 |
|
| Right-of-use assets obtained in exchange for operating lease obligations |
|
$ |
3,768 |
|
|
$ |
2,671 |
|
|
$ |
3,866 |
|
Balance Sheet
Supplemental balance sheet information related to leases is as follows:
| |
|
December 31, 2022 |
|
|
December 31, 2021 |
|
| Operating Leases |
|
|
|
|
|
|
|
|
| Operating lease right-of-use assets |
|
$ |
17,432 |
|
|
$ |
18,462 |
|
| |
|
|
|
|
|
|
|
|
| Other current liabilities |
|
|
4,862 |
|
|
|
4,623 |
|
| Operating lease liabilities |
|
|
14,025 |
|
|
|
15,408 |
|
| Total operating lease liabilities |
|
$ |
18,887 |
|
|
$ |
20,031 |
|
| |
|
|
|
|
|
|
|
|
| Weighted Average Remaining Lease Term (in months) |
|
|
|
|
|
|
|
|
| Operating leases |
|
|
59 |
|
|
|
62 |
|
| |
|
|
|
|
|
|
|
|
| Weighted Average Discount Rate |
|
|
|
|
|
|
|
|
| Operating leases |
|
|
4.69 |
% |
|
|
4.79 |
% |
Lease Maturities
Maturities of leases were as follows:
| Year ending December 31, |
|
Operating Leases |
|
| 2023 |
|
$ |
5,678 |
|
| 2024 |
|
|
4,808 |
|
| 2025 |
|
|
3,992 |
|
| 2026 |
|
|
2,823 |
|
| 2027 |
|
|
1,560 |
|
| Thereafter |
|
|
2,177 |
|
| Total Lease Payments |
|
|
21,038 |
|
| Less: imputed interest |
|
|
(2,151 |
) |
| Total |
|
$ |
18,887 |
|
Notes to Consolidated Financial Statements (Continued)
Years ended
December 31, 2022,
2021 and
2020
(Dollars in Thousands Except Per Share Data)
8. Other Intangible Assets
The following is a summary of the Company’s other intangible assets:
| |
|
Gross |
|
|
Less |
|
|
Net |
|
| |
|
Carrying |
|
|
Accumulated |
|
|
Carrying |
|
| |
|
Amount |
|
|
Amortization |
|
|
Amount |
|
| December 31, 2022 |
|
|
|
|
|
|
|
|
|
|
|
|
| Indefinite-lived intangibles: |
|
|
|
|
|
|
|
|
|
|
|
|
| Trademark and tradenames |
|
$ |
77,600 |
|
|
$ |
- |
|
|
$ |
77,600 |
|
| Amortizable intangibles: |
|
|
|
|
|
|
|
|
|
|
|
|
| Dealer network |
|
|
80,000 |
|
|
|
75,000 |
|
|
|
5,000 |
|
| Customer relationships |
|
|
80,920 |
|
|
|
37,537 |
|
|
|
43,383 |
|
| Patents |
|
|
21,136 |
|
|
|
16,994 |
|
|
|
4,142 |
|
| Noncompete agreements |
|
|
8,640 |
|
|
|
8,640 |
|
|
|
- |
|
| Trademarks |
|
|
5,459 |
|
|
|
3,995 |
|
|
|
1,464 |
|
| Amortizable intangibles, net |
|
|
196,155 |
|
|
|
142,166 |
|
|
|
53,989 |
|
| Total |
|
$ |
273,755 |
|
|
$ |
142,166 |
|
|
$ |
131,589 |
|
| |
|
Gross |
|
|
Less |
|
|
Net |
|
| |
|
Carrying |
|
|
Accumulated |
|
|
Carrying |
|
| |
|
Amount |
|
|
Amortization |
|
|
Amount |
|
| December 31, 2021 |
|
|
|
|
|
|
|
|
|
|
|
|
| Indefinite-lived intangibles: |
|
|
|
|
|
|
|
|
|
|
|
|
| Trademark and tradenames |
|
$ |
77,600 |
|
|
$ |
- |
|
|
$ |
77,600 |
|
| Amortizable intangibles: |
|
|
|
|
|
|
|
|
|
|
|
|
| Dealer network |
|
|
80,000 |
|
|
|
71,000 |
|
|
|
9,000 |
|
| Customer relationships |
|
|
80,920 |
|
|
|
32,366 |
|
|
|
48,554 |
|
| Patents |
|
|
21,136 |
|
|
|
15,739 |
|
|
|
5,397 |
|
| Noncompete agreements |
|
|
8,640 |
|
|
|
8,640 |
|
|
|
- |
|
| Trademarks |
|
|
5,459 |
|
|
|
3,901 |
|
|
|
1,558 |
|
| Amortizable intangibles, net |
|
|
196,155 |
|
|
|
131,646 |
|
|
|
64,509 |
|
| Total |
|
$ |
273,755 |
|
|
$ |
131,646 |
|
|
$ |
142,109 |
|
Notes to Consolidated Financial Statements (Continued)
Years ended
December 31, 2022,
2021 and
2020
(Dollars in Thousands Except Per Share Data)
Amortization expense for intangible assets was $10,520, $10,682 and $10,931 for the years ended December 31, 2022, 2021 and 2020, respectively. Estimated amortization expense for the next five years is as follows:
| 2023 |
|
$ |
10,520 |
|
| 2024 |
|
|
7,520 |
|
| 2025 |
|
|
6,075 |
|
| 2026 |
|
|
5,450 |
|
| 2027 |
|
|
5,450 |
|
The weighted average remaining life for intangible assets is 7.6 years at December 31, 2022.
9. Long‑Term Debt
Long‑term debt is summarized below:
| | | December 31, | |
| | | 2022 | | | 2021 | |
| | | | | | | | | |
| Term Loan, net of debt discount of $387 and $499 at December 31, 2022 and December 31, 2021, respectively | | $ | 207,737 | | | $ | 218,875 | |
| Less current maturities | | | 11,137 | | | | 11,137 | |
| Long term debt before deferred financing costs | | | 196,600 | | | | 207,738 | |
| Deferred financing costs, net | | | 1,301 | | | | 1,680 | |
| Long term debt, net | | $ | 195,299 | | | $ | 206,058 | |
| The scheduled maturities on long term debt at December 31, 2022, are as follows: |
|
|
|
|
| 2023 |
|
$ |
11,137 |
|
| 2024 |
|
|
13,950 |
|
| 2025 |
|
|
19,575 |
|
| 2026 |
|
|
163,075 |
|
| |
|
$ |
207,737 |
|
On June 9, 2021, the Company entered into a Credit Agreement (the “Credit Agreement”) with a group of banks and financial institutions. The Credit Agreement provides for a senior secured term loan in the amount of $225,000 and a senior secured revolving credit facility in the amount of $100,000, of which $10,000 will be available in the form of letters of credit and $15,000 will be available for the issuance of short-term swingline loans. The Credit Agreement also allows the Company to request increases to the revolving commitments and/or incremental term loans in an aggregate amount not in excess of $175,000, subject to specified terms and conditions. The final maturity date of the Credit Agreement is June 9, 2026. The Company applied the proceeds of the senior secured term loan facility under the Credit Agreement to refinance its existing senior secured term loan and revolving credit facilities and for the payment of transaction consideration and expenses in connection with the Credit Agreement.
Notes to Consolidated Financial Statements (Continued)
Years ended
December 31, 2022,
2021 and
2020
(Dollars in Thousands Except Per Share Data)
The Company will be required to pay a fee for unused amounts under the senior secured revolving facility in an amount ranging from 0.150% to 0.300% of the average daily unused portion of the senior secured revolving credit facility, depending on the Company’s Leverage Ratio (as defined in the Credit Agreement). The Credit Agreement provides that the senior secured term loan facility will bear interest at (i) the London Interbank Offered Rate for the applicable interest period multiplied by the Statutory Reserve Rate (as defined in the Credit Agreement) plus (ii) a margin ranging from 1.375% to 2.00%, depending on the Company’s Leverage Ratio. The Credit Agreement provides that the Company has the option to select whether the senior secured revolving credit facility borrowings will bear interest at either (i)(a) the London Interbank Offered Rate for the applicable interest period multiplied by the Statutory Reserve Rate (as defined in the Credit Agreement) plus (b) a margin ranging from 1.375% to 2.00%, depending on the Company’s Leverage Ratio, or (ii) a margin ranging from 0.375% to 1.00% per annum, depending on the Company’s Leverage Ratio, plus the greatest of (which if the following would be less than 1.00%, such rate shall be deemed to be 1.00%) (a) the Prime Rate (as defined in the Credit Agreement) in effect on such day, (b) the NYFRB Rate (as defined in the Credit Agreement) plus 0.50% and (c) the London Interbank Offered Rate for a one month interest period multiplied by the Statutory Reserve Rate plus 1%. If the London Interbank Offered Rate for the applicable interest period is less than zero, such rate shall be deemed to be zero for purposes of calculating the foregoing interest rates in the Credit Agreement.
The Credit Agreement was issued at a $563 discount which is being amortized over the term of the term loan. Additionally, deferred financing costs of $1,409 are being amortized over the term of the loan. The Company’s entrance into the Credit Agreement and subsequent settlement of its prior credit agreements is accounted for as an extinguishment of the Company’s prior debt under ASC 470-50, which resulted in the write off of unamortized capitalized deferred financing costs of $972 as well as the write off of unamortized debt discount of $3,964, resulting in a loss on extinguishment of debt of $4,936 in the Consolidated Statement Operations and Comprehensive Income (Loss) for the year ended December 31, 2021.
At December 31, 2022, the Company had outstanding borrowings under the term loan of $207,737, no outstanding borrowings on the revolving credit facility and remaining borrowing availability of $99,450.
The Credit Agreement includes customary representations, warranties and negative and affirmative covenants, as well as customary events of default and certain cross default provisions that could result in acceleration of the Credit Agreement. In addition, the Credit Agreement requires the Company to have a Leverage Ratio of not more than 3.50 to 1.00 as of the last day of any fiscal quarter commencing with the fiscal quarter ending June 30, 2021, and to have a Consolidated Interest Coverage Ratio (as defined in the Credit Agreement) of not less than 3.00 to 1.00 as of the last day of any fiscal quarter commencing with the fiscal quarter ending June 30, 2021. As of December 31, 2022, the Company is in compliance with the respective covenants.
In accordance with the Company’s prior credit agreements, the Company was required to make additional principal prepayments over the above scheduled payments under certain conditions. This included, in the case of the term loan facility, 100% of the net cash proceeds of certain asset sales, certain insurance or condemnation events, certain debt issuances, and, within 150 days of the end of each fiscal year, 50% of consolidated excess cash flow including a deduction for certain distributions (which percentage is reduced to 0% upon the achievement of certain leverage ratio thresholds), for such fiscal year. Consolidated excess cash flow was defined in the senior credit facilities as consolidated Adjusted EBITDA (earnings before interest, taxes, depreciation and amortization) plus a consolidated working capital adjustment, less the sum of repayments of debt and capital expenditures (subject to certain adjustments), interest and taxes paid in cash, management fees and certain restricted payments (including certain dividends or distributions). Consolidated working capital adjustment was defined in the senior credit facilities as the change in working capital, defined as current assets, excluding cash and cash equivalents, less current liabilities, excluding the current portion of long-term debt. The Company made a voluntary payment of $20,000 on its debt on January 31, 2020, a voluntary payment of $30,000 on its debt on December 31, 2020, and voluntary payment of $20,000 on its debt on March 31, 2021.
Notes to Consolidated Financial Statements (Continued)
Years ended
December 31, 2022,
2021 and
2020
(Dollars in Thousands Except Per Share Data)
On June 13, 2019, the Company entered into an interest rate swap agreement to reduce its exposure to interest rate volatility. The interest rate swap has a notional amount of $175,000 effective for the period May 31, 2019 through May 31, 2024. The Company may have counterparty credit risk resulting from the interest rate swap, which it monitors on an on-going basis. The risk lies with one global financial institution. Under the interest rate swap agreement, the Company will either receive or make payments on a monthly basis based on the differential between 2.495% and LIBOR (with a LIBOR floor of 1.0%). The interest rate swap was previously accounted for as a cash flow hedge. During the first quarter of 2020, the swap was determined to be ineffective. As a result, the swap was dedesignated on March 19, 2020, and the remaining losses included in Accumulated other comprehensive loss on the Consolidated Balance Sheets would be amortized into interest expense on a straight line basis through the life of the swap. The amount amortized from Accumulated other comprehensive loss into earnings during the years ended December 31, 2022 and 2021 was ($1,163) and $568, respectively. A mark-to-market adjustment of $476 and ($1,760) was recorded as Interest expense in the Consolidated Statements of Income (Loss) for the years ended December 31, 2022 and 2021, respectively, related to the swap.
On June 9, 2021, in conjunction with entering into the Credit Agreement described above, the Company re-designated its swap. As a result, the swap will be recorded at fair value with changes recorded in Accumulated other comprehensive loss. The amortization from Accumulated other comprehensive income into earnings from the previous dedesignation has been adjusted as of June 9, 2021 to include the de-recognition of previously recognized mark-to-market gains and the amortization of the off-market component as of the re-designation date, and will continue to be recognized through the life of the swap. The amount expected to be amortized from Accumulated other comprehensive loss into earnings in the next twelve months is $687.
On May 19, 2022, the Company entered into an interest rate swap agreement to further reduce its exposure to interest rate volatility. The interest rate swap has a notional amount of $125,000 effective for the period May 31, 2024 through June 9, 2026. The Company may have counterparty credit risk resulting from the interest rate swap, which it monitors on an on-going basis. The risk lies with two global financial institutions. Under the interest rate swap agreement, the Company will either receive or make payments on a monthly basis based on the differential between 2.718% and SOFR. The interest rate swap is accounted for as a cash flow hedge.
The interest rate swaps' positive fair value at December 31, 2022 was $7,039, of which $4,120 and $2,919 are included in Prepaid and other current assets and Other long-term assets on the Consolidated Balance Sheet, respectively. The interest rate swap’s negative fair value at December 31, 2021 was $6,428, of which $3,479 and $2,949 are included in Accrued expenses and other current liabilities and Other long-term liabilities on the Consolidated Balance Sheet, respectively.
The Company receives on consignment, truck chassis on which it performs upfitting service installations under “bailment pool” arrangements with major truck manufacturers. The Company never receives title to the truck chassis. The aggregate value of all bailment pool chassis on hand as of December 31, 2022 and 2021 was $7,847 and $8,439, respectively. The Company is responsible to the manufacturer for interest on chassis held for upfitting. Interest rates vary depending on the number of days in the bailment pool. As of December 31, 2022, rates were based on prime (7.50% at December 31, 2022) plus a margin ranging from 0% to 8%. During 2022, the Company incurred $11 in interest on the bailment pool arrangement. During 2021, the Company incurred $72 in interest on the bailment pool arrangement.
The Company has a floor plan line of credit for up to $5,000 with a financial institution. The current terms of the line of credit are contained in a credit agreement dated July 15, 2016 and expired on July 31, 2017, which the Company renewed through February 28, 2023. Under the floor plan agreement the Company receives truck chassis and title on upfitting service installations. Upon upfit completion, the title transfers from the Company to the dealer customer. The note bears interest at an adjusted LIBOR rate, plus an applicable rate of 1.75%. The obligation under the floor plan agreement as of December 31, 2022 and 2021 is $1,211 and $2,655, respectively. During 2022, the Company incurred $321 in interest on the floor plan arrangements. During 2021, the Company incurred $108 in interest on the floor plan arrangements.
Notes to Consolidated Financial Statements (Continued)
Years ended
December 31, 2022,
2021 and
2020
(Dollars in Thousands Except Per Share Data)
10. Accrued Expenses and Other Current Liabilities
Accrued expenses and other current liabilities are summarized as follows:
| |
|
December 31, |
|
| |
|
2022 |
|
|
2021 |
|
| |
|
|
|
|
|
|
|
|
| Payroll and related costs |
|
$ |
10,805 |
|
|
$ |
13,299 |
|
| Employee benefits |
|
|
8,863 |
|
|
|
8,933 |
|
| Accrued warranty |
|
|
4,558 |
|
|
|
3,645 |
|
| Interest rate swaps |
|
|
- |
|
|
|
3,479 |
|
| Other |
|
|
6,258 |
|
|
|
6,770 |
|
| |
|
$ |
30,484 |
|
|
$ |
36,126 |
|
11. Warranty Liability
The Company accrues for estimated warranty costs as sales are recognized and periodically assesses the adequacy of its recorded warranty liability and adjusts the amount as necessary. The Company’s warranties generally provide, with respect to its snow and ice control equipment, that all material and workmanship will be free from defect for a period of one to two years after the date of purchase by the end‑user, and with respect to its parts and accessories purchased separately, that such parts and accessories will be free from defect for a period of one year after the date of purchase by the end‑user. Certain snowplows only provide for a one year warranty. The Company determines the amount of the estimated warranty costs (and its corresponding warranty reserve) using the expected value method, and is based on the Company’s prior five years of warranty history utilizing a formula driven by historical warranty expense and applying management’s judgment. The Company adjusts its historical warranty costs to take into account unique factors such as the introduction of new products into the marketplace that do not provide a historical warranty record to assess. All of the Company’s warranties are assurance-type warranties. The warranty reserve is $7,876 at December 31, 2022 of which $3,318 is included in Other long-term liabilities and $4,558 is included in Accrued expenses and other current liabilities in the accompanying Consolidated Balance Sheet. At December 31, 2021, the warranty reserve is $6,368 of which $2,723 is included in Other long term liabilities and $3,645 is included in Accrued expenses and other current liabilities in the accompanying Consolidated Balance Sheet.
The following is a rollforward of the Company’s warranty liability:
| |
|
December 31, |
|
| |
|
2022 |
|
|
2021 |
|
|
2020 |
|
| |
|
|
|
|
|
|
|
|
|
|
|
|
| Balance at the beginning of the period |
|
|
6,368 |
|
|
|
5,812 |
|
|
|
6,541 |
|
| Warranty provision |
|
|
4,835 |
|
|
|
5,270 |
|
|
|
3,202 |
|
| Claims paid/settlements |
|
|
(3,327 |
) |
|
|
(4,714 |
) |
|
|
(3,931 |
) |
| Balance at the end of the period |
|
|
7,876 |
|
|
|
6,368 |
|
|
|
5,812 |
|
Notes to Consolidated Financial Statements (Continued)
Years ended
December 31, 2022,
2021 and
2020
(Dollars in Thousands Except Per Share Data)
12. Income Taxes
The provision for income tax expense (benefit) consists of the following:
| |
|
Year ended December 31 |
|
| |
|
2022 |
|
|
2021 |
|
|
2020 |
|
| Current: |
|
|
|
|
|
|
|
|
|
|
|
|
| Federal |
|
$ |
10,515 |
|
|
$ |
4,246 |
|
|
$ |
5,509 |
|
| State |
|
|
1,505 |
|
|
|
(1,967 |
) |
|
|
1,621 |
|
| |
|
|
12,020 |
|
|
|
2,279 |
|
|
|
7,130 |
|
| Deferred: |
|
|
|
|
|
|
|
|
|
|
|
|
| Federal |
|
|
(2,187 |
) |
|
|
1,874 |
|
|
|
(17,135 |
) |
| State |
|
|
(1,081 |
) |
|
|
(256 |
) |
|
|
(2,271 |
) |
| |
|
|
(3,268 |
) |
|
|
1,618 |
|
|
|
(19,406 |
) |
| |
|
$ |
8,752 |
|
|
$ |
3,897 |
|
|
$ |
(12,276 |
) |
A reconciliation of income tax expense computed at the federal statutory rate to the provision for income taxes for the years ended December 31, 2022, 2021 and 2020 is as follows:
| |
|
2022 |
|
|
2021 |
|
|
2020 |
|
| Federal income tax expense at statutory rate |
|
$ |
9,946 |
|
|
$ |
7,264 |
|
|
$ |
(20,752 |
) |
| State taxes, net of federal benefit |
|
|
1,445 |
|
|
|
(1,329 |
) |
|
|
(2,820 |
) |
| Valuation allowance |
|
|
(1,202 |
) |
|
|
(101 |
) |
|
|
1,762 |
|
| Change in uncertain tax positions, net |
|
|
356 |
|
|
|
(705 |
) |
|
|
679 |
|
| Research and development credit |
|
|
(1,333 |
) |
|
|
(859 |
) |
|
|
(536 |
) |
| State rate change |
|
|
(168 |
) |
|
|
(652 |
) |
|
|
157 |
|
| Goodwill impairment |
|
|
- |
|
|
|
- |
|
|
|
10,038 |
|
| Other |
|
|
(292 |
) |
|
|
279 |
|
|
|
(804 |
) |
| |
|
$ |
8,752 |
|
|
$ |
3,897 |
|
|
$ |
(12,276 |
) |
Notes to Consolidated Financial Statements (Continued)
Years ended
December 31, 2022,
2021 and
2020
(Dollars in Thousands Except Per Share Data)
Significant components of the Company’s deferred tax liabilities and assets are as follows:
| |
|
December 31, |
|
| |
|
2022 |
|
|
2021 |
|
| Deferred tax assets: |
|
|
|
|
|
|
|
|
| Allowance for doubtful accounts |
|
$ |
341 |
|
|
$ |
756 |
|
| Inventory reserves |
|
|
1,367 |
|
|
|
1,505 |
|
| Warranty liability |
|
|
1,856 |
|
|
|
1,551 |
|
| Deferred compensation |
|
|
2,349 |
|
|
|
1,659 |
|
| Earnout liabilities |
|
|
245 |
|
|
|
297 |
|
| Pension and retiree health benefit obligations |
|
|
1,344 |
|
|
|
1,573 |
|
| Interest rate swap |
|
|
- |
|
|
|
1,615 |
|
| Accrued vacation |
|
|
1,278 |
|
|
|
1,440 |
|
| Medical claims reserve |
|
|
- |
|
|
|
48 |
|
| Research expenditures |
|
|
3,711 |
|
|
|
- |
|
| Operating lease liabilities |
|
|
4,648 |
|
|
|
5,011 |
|
| Net operating losses |
|
|
2,126 |
|
|
|
3,182 |
|
| Other accrued liabilities |
|
|
4,301 |
|
|
|
5,106 |
|
| Other |
|
|
990 |
|
|
|
663 |
|
| Valuation allowance |
|
|
(2,071 |
) |
|
|
(3,273 |
) |
| Total deferred tax assets |
|
|
22,485 |
|
|
|
21,133 |
|
| Deferred tax liabilities: |
|
|
|
|
|
|
|
|
| Interest rate swaps |
|
|
(1,729 |
) |
|
|
- |
|
| Tax deductible goodwill and other intangibles |
|
|
(35,492 |
) |
|
|
(35,609 |
) |
| Accelerated depreciation |
|
|
(10,225 |
) |
|
|
(9,918 |
) |
| Operating leases - right of use assets |
|
|
(4,288 |
) |
|
|
(4,626 |
) |
| Other |
|
|
(588 |
) |
|
|
(769 |
) |
| Total deferred tax liabilities |
|
|
(52,322 |
) |
|
|
(50,922 |
) |
| Net deferred tax liabilities |
|
$ |
(29,837 |
) |
|
$ |
(29,789 |
) |
Deferred income tax balances reflect the effects of temporary differences between the carrying amount of assets and liabilities and their tax bases and are stated at enacted tax rates expected to be in effect when taxes are actually paid or recovered.
Notes to Consolidated Financial Statements (Continued)
Years ended
December 31, 2022,
2021 and
2020
(Dollars in Thousands Except Per Share Data)
State operating loss carry forwards for tax purposes will result in future tax benefits of approximately $1,422. These loss carry-forwards began to expire in 2021. The Company evaluated the need to maintain a valuation allowance against certain deferred tax assets. Based on this evaluation, which included a review of recent profitability, future projections of profitability, and future deferred tax liabilities, the Company concluded that a valuation allowance of approximately $1,368 is necessary at December 31, 2022 for the state net operating loss carry-forwards which are likely to expire prior to the Company's ability to use the tax benefit. The Company also carries a valuation allowance for approximately $704 related to non-state net operating loss carry-forwards which are likely to expire prior to the Company’s ability to use the tax benefit.
A reconciliation of the beginning and ending liability for uncertain tax positions is as follows:
| |
|
2022 |
|
|
2021 |
|
|
2020 |
|
| Balance at beginning of year |
|
$ |
1,214 |
|
|
$ |
1,954 |
|
|
$ |
1,219 |
|
| Increases for tax positions taken in the current year |
|
|
350 |
|
|
|
311 |
|
|
|
238 |
|
| Increases for tax positions taken in the prior years |
|
|
- |
|
|
|
- |
|
|
|
846 |
|
| Decreases due to settlements with taxing authorities |
|
|
- |
|
|
|
(991 |
) |
|
|
(83 |
) |
| Decreases due to lapses in the statute of limitations |
|
|
(45 |
) |
|
|
(60 |
) |
|
|
(266 |
) |
| Balance at the end of year |
|
$ |
1,519 |
|
|
$ |
1,214 |
|
|
$ |
1,954 |
|
The amount of the unrecognized tax benefits that would affect the effective tax rate, if recognized, was approximately $1,519 at December 31, 2022. The Company recognizes interest and penalties related to the unrecognized tax benefits in income tax expense. Approximately $581 and $466 of accrued interest and penalties is reported as an income tax liability at December 31, 2022 and 2021, respectively. The liability for unrecognized tax benefits is reported in Other Long‑term Liabilities on the Consolidated Balance Sheets at December 31, 2022 and 2021.
The Company files income tax returns in the United States (federal) and various states. Tax years open to examination by tax authorities under the statute of limitations include 2019, 2020 and 2021 for Federal and 2018 through 2021 for most states. Tax returns for the 2022 tax year have not yet been filed.
Beginning in 2022, the Tax Cuts and Jobs Act of 2017 eliminated the option to deduct research and development expenditures in the year incurred and required taxpayers to amortize them over a period of five years for tax purposes. This mandatory capitalization requirement increases our deferred tax assets and cash tax liabilities.
13. Employee Retirement Plans
Postretirement benefits
The Company provides postretirement healthcare benefits for certain employee groups. The postretirement healthcare plans are contributory and contain certain other cost‑sharing features such as deductibles and coinsurance. The plans are unfunded. Employees do not vest until they retire from active employment with the Company and have at least twelve years of service. These benefits can be amended or terminated at any time and are subject to the same ongoing changes as the Company’s healthcare benefits for employees with respect to deductible, co‑insurance and participant contributions. Postretirement benefits of $5,230 and $6,031 as of December 31, 2022 and December 31, 2021, respectively, are included in Retiree benefits and deferred compensation in the Consolidated Balance Sheets. Postretirement benefits of $240 and $230 as of December 31, 2022 and December 31, 2021, respectively, are included in Accrued expenses and other current liabilities in the Consolidated Balance Sheets.
Notes to Consolidated Financial Statements (Continued)
Years ended
December 31, 2022,
2021 and
2020
(Dollars in Thousands Except Per Share Data)
Effective January 1, 2004, the postretirement healthcare benefits were extended to all active employees of the Company as of December 31, 2003. The period of coverage was reduced and the retiree contribution percentage was increased in order to keep the cost of the plan equivalent to the previous plan design.
Maximum coverage under the plan is limited to ten years. All benefits terminate upon the death of the retiree. Employees who began working for the Company after December 31, 2003, are not eligible for postretirement healthcare benefits.
The reconciliation of the beginning and ending balances of the projected benefit obligation for the Company consisted of the following:
| | | December 31, | |
| | | 2022 | | | 2021 | |
| Change in projected benefit obligation: | | | | | | | | |
| Benefit obligation at beginning of year | | $ | 6,261 | | | $ | 6,736 | |
| Service cost | | | 115 | | | | 137 | |
| Interest cost | | | 153 | | | | 137 | |
| Participant contributions | | | 59 | | | | 52 | |
| Changes in actuarial assumptions | | | (972 | ) | | | (790 | ) |
| Benefits paid | | | (146 | ) | | | (11 | ) |
| Projected benefit obligation at end of year | | $ | 5,470 | | | $ | 6,261 | |
| Amounts recognized in the consolidated balance sheets consisted of: | | | | | | | | |
| Accrued expenses and other current liabilities | | $ | 240 | | | $ | 230 | |
| Retiree health benefit obligation | | | 5,230 | | | | 6,031 | |
| | | $ | 5,470 | | | $ | 6,261 | |
The components of postretirement healthcare benefit cost consisted of the following for the year ended December 31,
| | | 2022 | | | 2021 | | | 2020 | |
| Components of net postretirement health benefit cost: | | | | | | | | | | | | |
| Service cost | | $ | 115 | | | $ | 137 | | | $ | 147 | |
| Interest cost | | | 153 | | | | 137 | | | | 191 | |
| Amortization of net gain | | | (400 | ) | | | (312 | ) | | | (310 | ) |
| Net postretirement healthcare benefit cost | | $ | (132 | ) | | $ | (38 | ) | | $ | 28 | |
Notes to Consolidated Financial Statements (Continued)
Years ended
December 31, 2022,
2021 and
2020
(Dollars in Thousands Except Per Share Data)
The assumed discount and healthcare cost trend rates are summarized as follows:
| | | Year Ended December 31, | |
| | | 2022 | | | 2021 | | | 2020 | |
| Discount rate | | | 2.5 | % | | | 2.1 | % | | | 3.0 | % |
| Immediate healthcare cost trend rate | | | * | | | | ** | | | | *** | |
| Ultimate healthcare cost trend rate | | | 4.5 | | | | 4.5 | | | | 4.5 | |
| Assumed annual reduction in trend rate | | | * | | | | ** | | | | *** | |
| Participation | | | 60 | | | | 60 | | | | 60 | |
| * | Health Care Cost Trend rate is assumed to be 7.5% beginning in 2022 gradually reducing to an ultimate rate of 4.5% in 2031. |
| ** | Health Care Cost Trend rate is assumed to be 7.0% beginning in 2021 gradually reducing to an ultimate rate of 4.5% in 2030. |
| *** | Health Care Cost Trend rate is assumed to be 7.0% beginning in 2020 gradually reducing to an ultimate rate of 4.5% in 2029. |
The discount rate used to determine the benefit obligation at December 31, 2022 and 2021 is 5.0% and 2.5%, respectively. For December 31, 2022, the health care cost trend rate is assumed to be 7.5% beginning in 2022 gradually reducing to an ultimate rate of 4.5% in 2031. For December 31, 2021, the health care cost trend rate is assumed to be 7.0% beginning in 2021 gradually reducing to an ultimate rate of 4.5% in 2030. For December 31, 2020, the health care cost trend rate is assumed to be 7.0% beginning in 2020 gradually reducing to an ultimate rate of 4.5% in 2029.
No actuarial gains (losses) remain in accumulated other comprehensive income (loss) related to pension due to the termination of the plans. The amount included in accumulated other comprehensive income (loss), net of tax, at December 31, 2022, which has not yet been recognized in net periodic OPEB cost was a net actuarial gain of $3,013.
Defined contribution plan
The Company has a defined contribution plan, which qualifies under Section 401(k) of the Internal Revenue Code and provides substantially all employees an opportunity to accumulate personal funds for their retirement. Contributions are made on a before‑tax basis to the plan and are invested, at the employees’ direction, among a variety of investment alternatives including, commencing January 1, 2013, a Company common stock fund designated as an employee stock ownership plan.
As determined by the provisions of the plan, the Company matches a portion of the employees’ basic voluntary contributions. There were certain plan design changes in the year ended December 31, 2019 which changed the nature of the Company match. The Company matching contributions to the plan were approximately $4,999, $4,334 and $3,899 for the years ended December 31, 2022, 2021 and 2020, respectively. Beginning January 1, 2012, the Company amended its defined contribution plan to permit non‑discretionary employer contributions. The Company made non‑discretionary employer contributions of $0, $0 and $0 in the years ended December 31, 2022, 2021 and 2020, respectively. The Company made discretionary employer contributions of $470 in the year ended December 31, 2021.
Notes to Consolidated Financial Statements (Continued)
Years ended
December 31, 2022,
2021 and
2020
(Dollars in Thousands Except Per Share Data)
Non‑qualified plan
The Company also maintains a supplemental non‑qualified plan for certain officers and other key employees. Expense for this plan was $378, $475 and $523 for the years ended December 31, 2022, 2021 and 2020, respectively. The amount accrued was $9,420, $11,139 and $9,318 as of December 31, 2022, 2021 and 2020, respectively and is included in Retiree benefits and deferred compensation on the Consolidated Balance Sheets. Amounts were determined based on the fair value of the liability at December 31, 2022, 2021 and 2020, respectively. The Company holds assets that are substantially equivalent to the liability and are intended to fund the liability. Non-qualified plan assets of $8,874 and $10,347 at December 31, 2022 and December 31, 2021, respectively, are included as Non-qualified benefit plan assets on the Consolidated Balance Sheets.
14. Stock‑Based Compensation
2010 Stock Incentive Plan
In in May 2010, the Company’s Board of Directors and stockholders adopted the 2010 Stock Incentive Plan (the “2010 Plan”). The material terms of the performance goals under the 2010 Plan, as amended and restated, were approved by stockholders at the Company’s 2014 annual meeting of stockholders and the plan’s term was extended further by the stockholders at the Company’s 2020 annual meeting of stockholders. The 2010 Plan provides for the issuance of nonqualified stock options, incentive stock options, stock appreciation rights, restricted stock awards and restricted stock units, any of which may be performance‑based, and for incentive bonuses, which may be paid in cash or stock or a combination of both, to eligible employees, officers, non‑employee directors and other service providers to the Company and its subsidiaries. A maximum of 2,130,000 shares of common stock may be issued pursuant to all awards under the 2010 Plan. As of December 31, 2022, the Company had 531,267 shares of common stock available for future issuance of awards under the 2010 Plan. The shares of common stock to be issued under the 2010 Plan will be made available from authorized and unissued Company common stock.
Restricted Stock Units
Restricted stock units (“RSUs”) are granted to both non‑employee directors and management. Prior to 2013, RSUs were only issued to directors. However, in 2013, the Company changed the timing and form of management’s annual stock grants and began to grant RSUs to management. RSUs do not carry voting rights. While all non-employee director RSUs participate in dividend equivalents, there are two classes of management RSUs, one that participates in dividend equivalents, and a second that does not participate in dividend equivalents. Each RSU represents the right to receive one share of the Company’s common stock and is subject to time based vesting restrictions. Participants are not required to pay any consideration to the Company at either the time of grant of a RSU or upon vesting.
In 2013, the Company’s compensation committee approved a retirement provision for RSUs issued to management. The retirement provision provides that members of management who either (1) are age 65 or older or (2) have at least ten years of service and are at least age 55 will continue to vest in unvested RSUs upon retirement. As the retirement provision does not qualify as a substantive service condition, the Company incurred $3,724, $2,988 and $1,191 in additional expense in the years ended December 31, 2022, 2021 and 2020, respectively, as a result of accelerated stock based compensation expense for employees who meet the thresholds of the retirement provision. The Company’s nominating and governance committee also approved a retirement provision for the RSUs issued to non‑employee directors that accelerates the vesting of such RSUs upon retirement. Such awards are fully expensed immediately upon grant in accordance with ASC 718, as the retirement provision eliminates substantive service conditions associated with the awards.
Notes to Consolidated Financial Statements (Continued)
Years ended
December 31, 2022,
2021 and
2020
(Dollars in Thousands Except Per Share Data)
A summary of RSU activity for the years ended December 31, 2022, 2021 and 2020 is as follows:
| | | | | | | Weighted | | | Weighted | |
| | | | | | | Average | | | Average | |
| | | | | | | Grant | | | Remaining | |
| | | | | | | Date | | | Contractual | |
| | | Shares | | | Fair value | | | Term (in years) | |
| | | | | | | | | | | | | |
| Unvested at December 31, 2019 | | | 35,676 | | | $ | 36.49 | | | | 1.40 | |
| Granted | | | 49,349 | | | | 49.90 | | | | 0.80 | |
| Vested | | | (48,112 | ) | | | 45.49 | | | | | |
| Cancelled and forfeited | | | (891 | ) | | | 49.9 | | | | | |
| Unvested at December 31, 2020 | | | 36,022 | | | | 42.73 | | | | 1.40 | |
| Granted | | | 134,218 | | | | 44.48 | | | | 1.07 | |
| Vested | | | (88,225 | ) | | | 39.73 | | | | | |
| Cancelled and forfeited | | | (2,112 | ) | | | 44.48 | | | | | |
| Unvested at December 31, 2021 | | | 79,903 | | | | 48.87 | | | | 1.91 | |
| Granted | | | 117,969 | | | | 36.70 | | | | 1.27 | |
| Vested | | | (79,265 | ) | | | 40.80 | | | | | |
| Cancelled and forfeited | | | (7,343 | ) | | | 46.15 | | | | | |
| | | | | | | | | | | | | |
| Unvested at December 31, 2022 | | | 111,264 | | | $ | 41.89 | | | | 1.76 | |
| | | | | | | | | | | | | |
| Expected to vest in the future at December 31, 2022 | | | 108,242 | | | $ | 41.89 | | | | 1.76 | |
The Company recognized $2,947, $3,292 and $2,263 of compensation expense related to the RSU awards in the years ended December 31, 2022, 2021 and 2020, respectively. The unrecognized compensation expense, net of expected forfeitures, calculated under the fair value method for shares that were, as of December 31, 2022, expected to be earned through the requisite service period was approximately $1,471 and is expected to be recognized through 2025.
Beginning in 2019, grants to non-employee directors, vesting occurs as of the grant date. Vested director RSUs are “settled” by the delivery to the participant or a designated brokerage firm of one share of common stock per vested RSU as soon as reasonably practicable following a termination of service of the participant that constitutes a separation from service, or as soon as reasonably practicable upon grant if such election is made by the non-employee director, and in all events no later than the end of the calendar year in which such termination of service occurs or, if later, two and one‑half months after such termination of service. Vested management RSU’s are “settled” by the delivery to the participant or a designated brokerage firm of one share of common stock per vested RSU as soon as reasonably practicable following vesting.
Performance Share Unit Awards
The Company granted performance share units as performance based awards under the 2010 Plan in the first quarter of 2022, 2021 and 2020 that are subject to performance conditions over a three year performance period beginning in the year of the grant. Upon meeting the prescribed performance conditions, employees will be issued shares which vest immediately at the end of the measurement period. Currently the Company expects participants to earn 131,232, 66,364 and 16,488 shares related to the 2022, 2021 and 2020 performance share grants, respectively. In accordance with ASC 718, such awards are being expensed over the vesting period from the date of grant through the requisite service period, based upon the most probable outcome. In the first quarter of 2022 there were 29,399 performance share units that converted into RSUs. The fair value per share of the awards is the closing stock price on the date of grant, which was $37.57, $49.96 and $53.50 for the 2022, 2021 and 2020 grants, respectively. The Company recognized $3,783, $2,502 and $567 of compensation expense related to the awards in the years ended December 31, 2022, 2021 and 2020, respectively. The unrecognized compensation expense calculated under the fair value method for shares that were, as of December 31, 2022, expected to be recognized through the requisite service period was $2,126 and is expected to be recognized through 2025.
Notes to Consolidated Financial Statements (Continued)
Years ended
December 31, 2022,
2021 and
2020
(Dollars in Thousands Except Per Share Data)
15. Earnings (Loss) Per Share
Basic earnings (loss) per share of common stock is computed by dividing net income (loss) by the weighted average number of common shares outstanding during the period. Diluted earnings (loss) per share of common stock is computed by dividing net income (loss) by the weighted average number of common shares, using the two‑class method. As the Company has granted RSUs that both participate in dividend equivalents and do not participate in dividend equivalents, the Company has calculated earnings (loss) per share pursuant to the two‑class method, which is an earnings allocation formula that determines earnings (loss) per share for common stock and participating securities according to dividends declared and participation rights in undistributed earnings. Under this method, all earnings (distributed and undistributed) are allocated to common shares and participating securities based on their respective rights to receive dividends. Diluted net earnings (loss) per share is calculated by dividing net income (loss) attributable to common stockholders by the weighted average number of common stock and dilutive common stock outstanding during the period. Potential common shares in the diluted net earnings per share computation are excluded to the extent that they would be anti-dilutive. Weighted average of potentially dilutive non-participating RSU’s were 25,565 in the year ended December 31, 2020.
| | | 2022 | | | 2021 | | | 2020 | |
| Basic earnings (loss) per common share | | | | | | | | | | | | |
| Net income (loss) | | $ | 38,609 | | | $ | 30,691 | | | $ | (86,553 | ) |
| Less income allocated to participating securities | | | 741 | | | | 503 | | | | - | |
| Net income (loss) allocated to common shareholders | | $ | 37,868 | | | $ | 30,188 | | | $ | (86,553 | ) |
| Weighted average common shares outstanding | | | 22,915,543 | | | | 22,954,523 | | | | 22,846,467 | |
| | | $ | 1.65 | | | $ | 1.31 | | | $ | (3.81 | ) |
| Earnings (loss) per common share assuming dilution | | | | | | | | | | | | |
| Net income (loss) | | $ | 38,609 | | | $ | 30,691 | | | $ | (86,553 | ) |
| Less income allocated to participating securities | | | 741 | | | | 503 | | | | - | |
| Net income (loss) allocated to common shareholders | | $ | 37,868 | | | $ | 30,188 | | | $ | (86,553 | ) |
| Weighted average common shares outstanding | | | 22,915,543 | | | | 22,954,523 | | | | 22,846,467 | |
| Incremental shares applicable to stock based compensation | | | 1,281 | | | | 10,209 | | | | - | |
| Weighted average common shares assuming dilution | | | 22,916,824 | | | | 22,964,732 | | | | 22,846,467 | |
| | | $ | 1.63 | | | $ | 1.29 | | | $ | (3.81 | ) |
16. Commitments and Contingencies
In the ordinary course of business, the Company is engaged in various litigation including product liability and intellectual property disputes. However, the Company does not believe that any pending litigation will have a material adverse effect on its consolidated financial position, consolidated results of operations or liquidity. In addition, the Company is not currently a party to any environmental‑related claims or legal matters.
17. Segments
The Company operates through two operating segments for which separate financial information is available, and for which operating results are evaluated regularly by the Company's chief operating decision maker in determining resource allocation and assessing performance. The Company’s two current reportable business segments are described below.
Notes to Consolidated Financial Statements (Continued)
Years ended
December 31, 2022,
2021 and
2020
(Dollars in Thousands Except Per Share Data)
Work Truck Attachments. The Work Truck Attachments segment includes the Company’s operations that manufacture and sell snow and ice control attachments and other products sold under the FISHER®, WESTERN®, and SNOWEX® brands, as well as our vertically integrated products.
Work Truck Solutions. The Work Truck Solutions segment includes manufactured municipal snow and ice control products under the HENDERSON® brand and the up-fit of market leading attachments and storage solutions under the HENDERSON® brand, and the DEJANA® brand and its related sub-brands.
Segment performance is evaluated based on segment net sales and Adjusted EBITDA. Separate financial information is available for the two operating segments. In addition, segment results include an allocation of all corporate costs to Work Truck Attachments and Work Truck Solutions. No single customer’s revenues amounted to 10% or more of the Company’s total revenue. Sales are primarily within the United States and substantially all assets are located within the United States.
Sales between Work Truck Attachments and Work Truck Solutions reflect the Company’s intercompany pricing policy. The following table shows summarized financial information concerning the Company’s reportable segments:
| | | 2022 | | | 2021 | | | 2020 | |
| | | | | | | | | | | | | |
| Net sales | | | | | | | | | | | | |
| Work Truck Attachments | | $ | 382,296 | | | $ | 325,707 | | | $ | 252,838 | |
| Work Truck Solutions | | | 233,772 | | | | 215,746 | | | | 227,316 | |
| | | $ | 616,068 | | | $ | 541,453 | | | $ | 480,154 | |
| Adjusted EBITDA | | | | | | | | | | | | |
| Work Truck Attachments | | $ | 78,211 | | | $ | 77,369 | | | $ | 62,532 | |
| Work Truck Solutions | | | 8,569 | | | | 2,167 | | | | 12,360 | |
| | | $ | 86,780 | | | $ | 79,536 | | | $ | 74,892 | |
| Depreciation and amortization expense | | | | | | | | | | | | |
| Work Truck Attachments | | $ | 12,901 | | | $ | 11,937 | | | $ | 10,824 | |
| Work Truck Solutions | | | 8,037 | | | | 8,379 | | | | 8,913 | |
| | | $ | 20,938 | | | $ | 20,316 | | | $ | 19,737 | |
| Assets | | | | | | | | | | | | |
| Work Truck Attachments | | $ | 397,557 | | | $ | 384,566 | | | $ | 365,210 | |
| Work Truck Solutions | | | 199,334 | | | | 187,910 | | | | 213,992 | |
| | | $ | 596,891 | | | $ | 572,476 | | | $ | 579,202 | |
| Capital expenditures | | | | | | | | | | | | |
| Work Truck Attachments | | $ | 9,526 | | | $ | 10,434 | | | $ | 13,174 | |
| Work Truck Solutions | | | 2,876 | | | | 1,447 | | | | 1,508 | |
| | | $ | 12,402 | | | $ | 11,881 | | | $ | 14,682 | |
| Adjusted EBITDA | | | | | | | | | | | | |
| Work Truck Attachments | | $ | 78,211 | | | $ | 77,369 | | | $ | 62,532 | |
| Work Truck Solutions | | | 8,569 | | | | 2,167 | | | | 12,360 | |
| Total Adjusted EBITDA | | $ | 86,780 | | | $ | 79,536 | | | $ | 74,892 | |
| Less items to reconcile Adjusted EBITDA to Income (Loss) before taxes: | | | | | | | | | | | | |
| Interest expense - net | | | 11,253 | | | | 11,839 | | | | 20,238 | |
| Depreciation expense | | | 10,418 | | | | 9,634 | | | | 8,806 | |
| Amortization | | | 10,520 | | | | 10,682 | | | | 10,931 | |
| Purchase accounting (1) | | | - | | | | - | | | | (2,017 | ) |
| Stock based compensation | | | 6,730 | | | | 5,794 | | | | 2,830 | |
| Impairment charges | | | - | | | | 1,211 | | | | 127,872 | |
| Debt modification expense | | | - | | | | - | | | | 3,542 | |
| Loss on extinguishment of debt | | | - | | | | 4,936 | | | | - | |
| COVID-19 (2) | | | 48 | | | | 82 | | | | 1,391 | |
| Other charges (3) | | | 450 | | | | 770 | | | | 128 | |
| Income (Loss) before taxes | | $ | 47,361 | | | $ | 34,588 | | | $ | (98,829 | ) |
| (1) | Reflects $17 in reversal of earnout compensation related to Henderson, and $2,000 in reversal of earnout compensation related to Dejana in the year ended December 31, 2020. |
| (2) | Reflects incremental costs incurred related to the COVID-19 pandemic for the periods presented. Such COVID-19 related costs include increased expenses directly related to the pandemic, and do not include either production related overhead inefficiencies or lost or deferred sales. |
| (3) | Reflects expenses and accrual reversals for one time, unrelated legal, severance, restructuring and consulting fees for the periods presented. |
Notes to Consolidated Financial Statements (Continued)
Years ended
December 31, 2022,
2021 and
2020
(Dollars in Thousands Except Per Share Data)
18. Stockholders’ equity
Preferred Stock
The Company is authorized to issue 5,000,000 shares of preferred stock, par value $0.01 per share. Subject to any limitations under law or the Company’s certificate of incorporation, the Company’s board of directors is authorized to provide for the issuance of the shares of preferred stock in one or more series; to establish the number of shares to be included in each series; and to fix the designation, powers, privileges, preferences, relative participating, optional or other rights (if any), and the qualifications, limitations or restrictions of the shares of each series. As of December 31, 2022 and 2021, no shares of preferred stock were issued and outstanding.
Common Stock
The Company has 200,000,000 shares of common stock authorized, of which 22,886,793 and 22,980,951 shares were issued and outstanding as of December 31, 2022 and 2021, respectively. The par value of the common stock is $0.01 per share.
The holders of common stock are entitled to one vote per share on all matters submitted to a vote of stockholders. In the event of any voluntary or involuntary liquidation, dissolution or winding up of the Company, common stockholders would be entitled to share ratably in the Company’s assets and funds remaining after payment of liabilities.
19. Valuation and qualifying accounts
The Company’s valuation and qualifying accounts for the years ended December 31, 2022, 2021 and 2020 are as follows:
| |
|
Balance at |
|
|
Additions |
|
|
|
|
|
|
|
|
|
| |
|
beginning |
|
|
charged to |
|
|
Changes to |
|
|
Balance at |
|
| |
|
of year |
|
|
earnings |
|
|
reserve, net (1) |
|
|
end of year |
|
| Year ended December 31, 2022 |
|
|
|
|
|
|
|
|
|
|
|
|
|
|
|
|
| Allowance for credit losses |
|
$ |
2,970 |
|
|
$ |
(1,476 |
) |
|
$ |
(128 |
) |
|
$ |
1,366 |
|
| Valuation of deferred tax assets |
|
|
3,273 |
|
|
|
- |
|
|
|
(1,202 |
) |
|
|
2,071 |
|
| Year ended December 31, 2021 |
|
|
|
|
|
|
|
|
|
|
|
|
|
|
|
|
| Allowance for credit losses |
|
$ |
2,929 |
|
|
$ |
67 |
|
|
$ |
(26 |
) |
|
$ |
2,970 |
|
| Valuation of deferred tax assets |
|
|
3,374 |
|
|
|
- |
|
|
|
(101 |
) |
|
|
3,273 |
|
| Year ended December 31, 2020 |
|
|
|
|
|
|
|
|
|
|
|
|
|
|
|
|
| Allowance for credit losses |
|
$ |
1,487 |
|
|
$ |
1,081 |
|
|
$ |
361 |
|
|
$ |
2,929 |
|
| Valuation of deferred tax assets |
|
|
1,612 |
|
|
|
- |
|
|
|
1,762 |
|
|
|
3,374 |
|
| (1) |
Increases (deductions) from the allowance for credit losses equal accounts receivable written off and increases related to acquired businesses, less recoveries, against the allowance. See Note 2 for additional information. Increases (deductions) to the valuation of deferred tax assets relate to the reversals due to changes in management’s judgments regarding the future realization of the underlying deferred tax assets. |
Notes to Consolidated Financial Statements (Continued)
Years ended
December 31, 2022,
2021 and
2020
(Dollars in Thousands Except Per Share Data)
20. Changes in Accumulated Other Comprehensive Income (Loss) by Component
Changes to accumulated other comprehensive income (loss) by component for the year ended December 31, 2022 is as follows:
| |
|
Unrealized |
|
|
|
|
|
|
|
|
|
| |
|
Net Gain (Loss) |
|
|
Retiree |
|
|
|
|
|
| |
|
on Interest |
|
|
Health |
|
|
|
|
|
| |
|
Rate |
|
|
Benefit |
|
|
|
|
|
| |
|
Swap |
|
|
Obligation |
|
|
Total |
|
| Balance at December 31, 2021 |
|
$ |
(3,524 |
) |
|
$ |
2,471 |
|
|
$ |
(1,053 |
) |
| Other comprehensive gain before reclassifications |
|
|
8,587 |
|
|
|
838 |
|
|
|
9,425 |
|
| Amounts reclassified from accumulated other comprehensive income (loss): (1) |
|
|
1,052 |
|
|
|
(296 |
) |
|
|
756 |
|
| Balance at December 31, 2022 |
|
$ |
6,115 |
|
|
$ |
3,013 |
|
|
$ |
9,128 |
|
| |
|
|
|
|
|
|
|
|
|
|
|
|
| |
|
|
|
|
|
|
|
|
|
|
|
|
| (1) Amounts reclassified from accumulated other comprehensive income (loss): |
|
|
|
|
|
|
|
|
|
|
|
|
| Amortization of Other Postretirement Benefit items: |
|
|
|
|
|
|
|
|
|
|
|
|
| Actuarial gains (a) |
|
$ |
(400 |
) |
|
|
|
|
|
|
|
|
| Tax expense |
|
|
104 |
|
|
|
|
|
|
|
|
|
| Reclassification net of tax |
|
$ |
(296 |
) |
|
|
|
|
|
|
|
|
| |
|
|
|
|
|
|
|
|
|
|
|
|
| Realized losses on interest rate swaps reclassified to interest expense |
|
$ |
1,421 |
|
|
|
|
|
|
|
|
|
| Tax expense |
|
|
(369 |
) |
|
|
|
|
|
|
|
|
| Reclassification net of tax |
|
$ |
1,052 |
|
|
|
|
|
|
|
|
|
(a) – These components are included in the computation of benefit plan costs in Note 13.
F-
43
Notes to Consolidated Financial Statements (Continued)
Years ended
December 31, 2022,
2021 and
2020
(Dollars in Thousands Except Per Share Data)
Changes to accumulated other comprehensive income (loss) by component for the year ended December 31, 2021 is as follows:
| |
|
Unrealized |
|
|
|
|
|
|
|
|
|
| |
|
Net Loss |
|
|
Retiree |
|
|
|
|
|
| |
|
on Interest |
|
|
Health |
|
|
|
|
|
| |
|
Rate |
|
|
Benefit |
|
|
|
|
|
| |
|
Swap |
|
|
Obligation |
|
|
Total |
|
| Balance at December 31, 2020 |
|
$ |
(7,608 |
) |
|
$ |
2,113 |
|
|
$ |
(5,495 |
) |
| Other comprehensive gain before reclassifications |
|
|
943 |
|
|
|
589 |
|
|
|
1,532 |
|
| Amounts reclassified from accumulated other comprehensive income (loss): (1) |
|
|
3,141 |
|
|
|
(231 |
) |
|
|
2,910 |
|
| Balance at December 31, 2021 |
|
$ |
(3,524 |
) |
|
$ |
2,471 |
|
|
$ |
(1,053 |
) |
| |
|
|
|
|
|
|
|
|
|
|
|
|
| |
|
|
|
|
|
|
|
|
|
|
|
|
| (1) Amounts reclassified from accumulated other comprehensive income (loss): |
|
|
|
|
|
|
|
|
|
|
|
|
| Amortization of Other Postretirement Benefit items: |
|
|
|
|
|
|
|
|
|
|
|
|
| Actuarial gain (a) |
|
$ |
(312 |
) |
|
|
|
|
|
|
|
|
| Tax expense |
|
|
81 |
|
|
|
|
|
|
|
|
|
| Reclassification net of tax |
|
$ |
(231 |
) |
|
|
|
|
|
|
|
|
| |
|
|
|
|
|
|
|
|
|
|
|
|
| Realized losses on interest rate swaps reclassified to interest expense |
|
$ |
4,244 |
|
|
|
|
|
|
|
|
|
| Tax expense |
|
|
(1,103 |
) |
|
|
|
|
|
|
|
|
| Reclassification net of tax |
|
$ |
3,141 |
|
|
|
|
|
|
|
|
|
| (a) – These components are included in the computation of benefit plan costs in Note 13. |
21. Quarterly Financial Information (Unaudited)
| |
|
2022 |
|
| |
|
First |
|
|
Second |
|
|
Third |
|
|
Fourth |
|
| |
|
|
|
|
|
|
|
|
|
|
|
|
|
|
|
|
| Net sales |
|
$ |
102,601 |
|
|
$ |
187,561 |
|
|
$ |
166,100 |
|
|
$ |
159,806 |
|
| Gross profit |
|
$ |
21,064 |
|
|
$ |
51,233 |
|
|
$ |
41,269 |
|
|
$ |
37,890 |
|
| Income (loss) before taxes |
|
$ |
(4,925 |
) |
|
$ |
23,090 |
|
|
$ |
16,175 |
|
|
$ |
13,021 |
|
| Net income (loss) |
|
$ |
(3,908 |
) |
|
$ |
17,725 |
|
|
$ |
13,280 |
|
|
$ |
11,512 |
|
| Basic net earnings (loss) per common share attributable to common shareholders |
|
$ |
(0.18 |
) |
|
$ |
0.76 |
|
|
$ |
0.57 |
|
|
$ |
0.49 |
|
| Earnings (loss) per common share assuming dilution attributable to common shareholders |
|
$ |
(0.18 |
) |
|
$ |
0.75 |
|
|
$ |
0.56 |
|
|
$ |
0.49 |
|
| Dividends per share |
|
$ |
0.29 |
|
|
$ |
0.29 |
|
|
$ |
0.29 |
|
|
$ |
0.29 |
|
Notes to Consolidated Financial Statements (Continued)
Years ended
December 31, 2022,
2021 and
2020
(Dollars in Thousands Except Per Share Data)
| |
|
2021 |
|
| |
|
First |
|
|
Second |
|
|
Third |
|
|
Fourth |
|
| |
|
|
|
|
|
|
|
|
|
|
|
|
|
|
|
|
| Net sales |
|
$ |
103,342 |
|
|
$ |
157,530 |
|
|
$ |
127,636 |
|
|
$ |
152,945 |
|
| Gross profit |
|
$ |
26,252 |
|
|
$ |
48,798 |
|
|
$ |
30,635 |
|
|
$ |
36,187 |
|
| Income before taxes |
|
$ |
665 |
|
|
$ |
14,919 |
|
|
$ |
8,234 |
|
|
$ |
10,770 |
|
| Net income |
|
$ |
742 |
|
|
$ |
14,103 |
|
|
$ |
7,030 |
|
|
$ |
8,816 |
|
| Basic net earnings per common share attributable to common shareholders |
|
$ |
0.03 |
|
|
$ |
0.60 |
|
|
$ |
0.30 |
|
|
$ |
0.38 |
|
| Earnings per common share assuming dilution attributable to common shareholders |
|
$ |
0.03 |
|
|
$ |
0.60 |
|
|
$ |
0.30 |
|
|
$ |
0.37 |
|
| Dividends per share |
|
$ |
0.29 |
|
|
$ |
0.29 |
|
|
$ |
0.29 |
|
|
$ |
0.29 |
|
Due to the timing of issuance of shares, the sum of quarterly earnings per share may not equal the annual earnings per share.
22. Subsequent Events
On June 9, 2021, Douglas Dynamics, Inc. (the “Company”), as guarantor, and its wholly-owned subsidiaries, Douglas Dynamics, L.L.C. (“DDI LLC” or the “Term Loan Borrower”), Fisher, LLC (“Fisher”), Trynex International LLC (“Trynex”), Henderson Enterprises Group, Inc. (“Enterprises”), Henderson Products, Inc. (“Products”), and Dejana Truck & Utility Equipment Company, LLC (“Dejana”, together with DDI LLC, Fisher, Trynex, Enterprises and Products, the “Revolving Loan Borrowers”, and together with DDI LLC in its capacity as the Term Loan Borrower, the “Borrowers”), as borrowers, entered into a Credit Agreement (following such time as it was amended by the Amendment No. 1 (as defined below), the “Credit Agreement”) with the banks and financial institutions listed in the Credit Agreement, as lenders, JPMorgan Chase Bank, N.A., as administrative agent, J.P. Morgan Chase Bank, N.A. and CIBC Bank USA, as joint lead arrangers and joint bookrunners, CIBC Bank USA, as syndication agent, and Bank of America, N.A. and Citizens Bank, N.A., as co-documentation agents.
The Credit Agreement provides for a senior secured term loan to the Term Loan Borrower in the amount of
$225.0 million and a senior secured revolving credit facility available to the Revolving Loan Borrowers in the amount of
$100.0 million, of which
$10.0 million will be available in the form of letters of credit and
$15.0 million will be available for the issuance of short-term swingline loans. The Credit Agreement also allows the Revolving Loan Borrowers to request increases to the revolving commitments and/or incremental term loans in an aggregate amount
not in excess of
$175.0 million (the “Revolving Commitment Increase Option”), subject to specified terms and conditions. The final maturity date of the Credit Agreement is
June 9, 2026.
On January 5, 2023, the Company entered into that certain Amendment No. 1 to Credit Agreement and Revolving Credit Commitment Increase Supplement (“Amendment No. 1”) by and among the Company, the Borrowers, the financial institutions listed in Amendment No. 1 as lenders, and JPMorgan Chase Bank, N.A., as administrative agent, which amended the Credit Agreement and pursuant to which, among other things, (i) the Revolving Loan Borrowers exercised a portion of the Revolving Commitment Increase Option and increased the revolving commitment under the Credit Agreement by $50.0 million for a total of $150.0 million in the aggregate and (ii) the London Interbank Offered Rate pricing option under the Credit Agreement was replaced with a Term SOFR Rate pricing option.
Pursuant to Amendment No. 1, the Credit Agreement provides that the senior secured term loan facility will bear interest at (i) the Term SOFR Rate for the applicable interest period plus (ii) a margin ranging from 1.375% to 2.00%, depending on DDI LLC’s Leverage Ratio. The Credit Agreement provides that the Revolving Loan Borrowers have the option to select whether the senior secured revolving credit facility borrowings will bear interest at either (i)(a) the Term SOFR Rate for the applicable interest period plus (b) 0.10% plus (c) a margin ranging from 1.375% to 2.00%, depending on DDI LLC’s Leverage Ratio, or (ii) a margin ranging from 0.375% to 1.00% per annum, depending on DDI LLC’s Leverage Ratio, plus the greatest of (which if the following would be less than 1.00%, such rate shall be deemed to be 1.00%) (a) the Prime Rate (as defined in the Credit Agreement) in effect on such day, (b) the NYFRB Rate (as defined in the Credit Agreement) plus 0.50% and (c) the Term SOFR Rate for a one month interest plus 0.10% (the “Adjusted Term SOFR Rate”). If the Adjusted Term SOFR Rate for the applicable interest period is less than zero, such rate shall be deemed to be zero for purposes of calculating the foregoing interest rates in the Credit Agreement.